Graphical analysis
Here, as elsewhere, risk is defined as the total number of deaths in a year (maternal or background) divided by person- years of exposure. Figure 11.5 shows five-year moving averages of (gross) MM risk, BM risk, net maternal mortality risk, and the probability of dying in childbirth (for comparison with the standard reporting measure) from the 1750s to the 1860s.30 The common measure of maternal deaths per birth (or per n births) tracks gross MM well.
Net MM, that is, gross MM minus BM, also tracks gross MM well, differing only where there are marked fluctuations in the background.Figure 11.6 shows net MM separately at parity 1 versus higher order births, truncating parity 1 data in 1860 to avoid the results of the cessation of marriage recording in 1857, but continuing higher order parities to 1870. The peaks of mortality for the two parity series are similar but not identical. The long-term increase in net maternal mortality at parity 1 is greater than for higher order births. This difference may offer a critical insight into explanatory scenarios. If MM is increased by increased labour demands on women, especially as economies of scale diminished with the decline of the joint household system, the data suggest that it was the youngest wives that bore the brunt of these demands. They were at the bottom of the household hierarchy, with few political allies. Their husbands were the youngest of a set of brothers, thus themselves political juniors, and would have been the most likely to be called up for military service, thus more likely to be absent. These young wives would have been asked to do most of the work. It is their mortality that increases most sharply over the long-run.
Figure 11.6 Net maternal mortality at parities 1 and >1, five-year moving averages
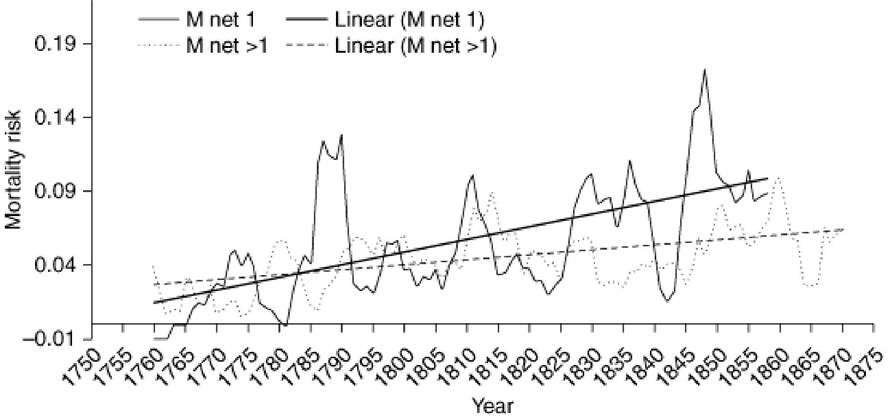
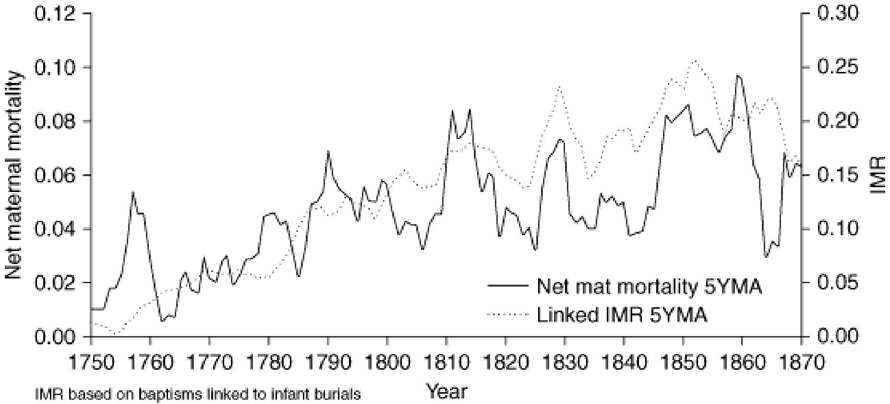
Figure 11.7 Net maternal mortality and infant mortality, five-year moving averages
6.3
More on the topic Graphical analysis:
- Compositional problems
- Beginnings
- References and further reading
- Kaldor’s non-linear trade cycle theory
- Economists, mathematicians and engineers
- Political economy in the faculties of law
- References and further reading