The Evidence of Mortality Statistics
The number of deaths in the eighteenth and early nineteenth centuries is shown in Figure 12.2. The development from 1735 onwards is based on contemporary national statistics, while the pre-1735 figures are partly reconstructed by inflating figures from the counts of a sample of parish registers in each diocese.
There are large fluctuations in the numbers from year to year until the late 1770s, followed by a significant diminution of the movements. Also, from the 1770s the gross mortality rates started to decline. This is in good agreement with the expectations of a rise in the general standard of living from the 1770s.
In order to test whether there is a relationship between the mortality fluctuations and the rye prices, correlation coefficients have been calculated for each diocese for the pre- and post-1775 periods. The coefficients are shown in Table 12.3.
Figure 12.2 Number of deaths in Denmark, 1700—1814
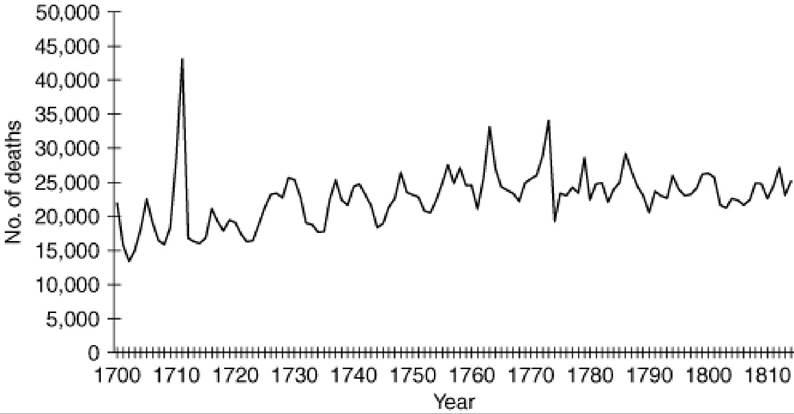
Table 12.3 Correlation coefficients between changes in rye prices, (pl-p,P)!p,-n and changes in mortality, (m-m-)/m-
| 1736-74 | 1775-1814 | |
| Diocese | ||
| Sealand | 0.47 | 0.07 |
| Funen | 0.13 | -0.08 |
| Ribe | 0.45 | -0.03 |
| Arhus | 0.42 | 0.10 |
| Viborg | 0.34 | 0.02 |
| Alborg | 0.27 | -0.14 |
NoteThe prices used are those determined in December the previous year in order to reflect harvest year prices.
After the mid-1770s the coefficients are very low and sometimes show a negative correlation, but even before 1775 the coefficients are low and explain only about one-fifth of the fluctuations, and the differences between the dioceses do not reflect any special patterns with regard to the size of land holdings, quality of land, or ownership. These results could be interpreted in various ways. One is that the agricultural reforms had the expected effects. There were, after 1775, very few years with situation no. 5 in Table 12.2 and therefore the majority of the population benefited from the rising price level, which resulted in only few years with undernourishment and high mortality. Another explanation could be that prices, to an increasing extent, did not reflect the harvest situation in Denmark, but the situation on the European grain market as a whole. A third might be that diseases that were not dependent on the general nourishment situation of the population caused several of the epidemics during the large mortality years.
For the country as a whole the change over time has been investigated for a still longer period. In Table 12.4, series for rye prices and the number of births and deaths have been used in a lagged model. The variables are the relative deviations from a nine-year moving average in order to eliminate the trend. The rye price is from the har vest year and the demographic events are from the partly overlapping calendar year that follows it.
In the first period, there is a highly significant covariation between the variations in the number of deaths and in the rye prices, but the total effect comes in the calendar year immediately after the poor harvest, and there are no significant coefficients in later years. For births, the effect is weaker but continues over the following year because the effect is via the conceptions, which means that many of the ‘missing’ births under normal circumstances would have taken place in the following year.
In the second period after 1775, the impact of price fluctuations on the number of deaths has disappeared—the parameter has the wrong sign and is not significant—which can be taken as a sign of the improvement of harvest yields and the general nourishment situation in the country. The impact on births is weaker and of shorter duration than before 1775. Also, the influence on the variation in the number of marriages for which statistics are now available is relatively weak. Finally, in the third period after 1840 all effects have disappeared.
In a somewhat similar study, Patrick R. Galloway has analysed the period 1756—1870, and for the period as a whole found a relation between the short-term variations in the demographic event rates and grain prices—although the effect is smaller for Denmark than for most other European countries. However, he does not divide this period into sub-periods and it is consequently not possible in his calculations to see to what extent the effect changes over time (Galloway 1988).
For those years after 1775 for which mortality statistics distributed according to the age of the deceased persons are available, some calculations have also been made for specific age groups (children and adults) in order to see if some of these were more vulnerable to changes in grain prices than the population at large. The worst inflation years between 1807 and 1814 have been left out because they may
Table 12.4 Covariation between fluctuations in demographic events and rye prices, 1669—1890
| Dependent variable | Parameter estimates of rye price | R2 | DW | |
| Harvest year | Previous year | |||
| 1669-1775 | ||||
| Births | -0.05772 | -0.05824 | 0.32 | 2.00 |
| (/-value) | (-3.59) | (-3.35) | — | — |
| Deaths’ | 0.27367 | — | 0.61 | 2.03 |
| (/-value) | (6.32) | — | — | — |
| 1775-1840 | ||||
| Births | -0.04112 | -0.00784 | — | — |
| (/-value) | (-3.51) | (-0.61) | 0.31 | 2.11 |
| Deaths | -0.02344 | — | — | — |
| (/-value) | (-0.77) | — | 0.08 | 2.02 |
| Marriages | -0.03012 | — | 0.21 | 2.09 |
| (/-value) | (-1.35) | — | — | — |
| 1840-90 | ||||
| Births | -0.00112 | -0.02302 | 0.09 | 1.87 |
| (/-value) | (-0.08) | (-1.69) | — | — |
| Deaths | -0.08380 | — | 0.19 | 2.14 |
| (/-value) | (-1.89) | — | — | — |
| Marriages | -0.02637 | — | 0.05 | 2.11 |
| (/-value) | (-0.55) | — | — | — |
‘ For 1711 (a plague year with an extremely high mortality), a dummy variable has been used.
have diverged from the pattern in the remaining years. None of these calculations do, however, give significant results indicating a close relationship between changes in mortality and rye prices and in most cases the correlations are, if anything, negative.
7.