Fertility
In spite of differences in economic context, variation in fertility levels between regions was less pronounced than variation within regions. Table 16.2 presents indices of fertility, male nuptiality, and mortality for the eleven state farm systems, along with totals for each region.
The total marital fertility rate (TMFR) in theTable 16.2 Levels of fertility, nuptiality, and mortality
| TMFR- 16-50 | Percentage of men ever married | Life expectancy | ||||||
| 6-15 sui | 16-25 sui | 26-35 sui | 36-50 sui | males 1 sui | males 16 sui | females 16 sui | ||
| North | 1.86 | 4.4 | 47.1 | 80.3 | 88.6 | 45.9 | 43.0 | 41.2 |
| Dami | 1.35 | 5.1 | 39.9 | 70.5 | 80.0 | 46.7 | 40.5 | 38.8 |
| Feicheng | 1.81 | 3.0 | 41.1 | 78.9 | 88.9 | 43.1 | 44.3 | 40.7 |
| Yimiancheng | ||||||||
| Dadianzi | 1.97 | 6.4 | 56.9 | 85.3 | 92.1 | 51.1 | 44.2 | 47.4 |
| Bakeshu | 1.89 | 2.9 | 44.6 | 80.4 | 88.5 | 44.7 | 40.4 | 36.0 |
| Central | 1.99 | 2.2 | 41.3 | 74.4 | 84.1 | 41.2 | 43.0 | 38.5 |
| Guosantu | ι2.14 | 2.6 | bgcolor=white>40.974.4 | 84.4 | 42.8 | 43.9 | 37.1 | |
| Daxingtun | 1.91 | 2.0 | 41.6 | 74.5 | 84.0 | 39.5 | 42.2 | 40.2 |
| Daoyi | 1.94 | 2.8 | 42.2 | 75.0 | 83.3 | 38.3 | 41.8 | 38.3 |
| South | 1.89 | 3.8 | 42.2 | 75.0 | 86.5 | 49.9 | 44.6 | 43.9 |
| Gaizhou Rending | 1.89 | 4.9 | 46.9 | 76.6 | 87.1 | 52.0 | 44.6 | 45.6 |
| Gaizhou Mianding | 2.02 | 3.1 | 49.2 | 81.0 | 89.5 | 48.7 | 41.8 | 40.8 |
| Niuzhuang Liuerbao | 1.96 | 3.5 | 47.1 | 78.6 | 86.0 | 48.1 | 45.4 | 43.2 |
| Gaizhou Manhan | 1.72 | 5.0 | 46.9 | 76.6 | 87.1 | 49.0 | 47.1 | 43.4 |
| Total | 1.90 | 3.5 | 45.3 | 77.7 | 86.5 | 44.1 | 43.0 | 41.7 |
The calculation of marital fertility is based on male births to married women that survive to be recorded in a register.
Adjustments for the omission of female births and births that die in infancy and childhood without being registered would yield a higher figure. As explained in note 9 in previous work we have used an adjustment factor of 2.91.highest fertility region, the central, was only 0.13 higher than in the lowest fertility region, the north. Fertility levels in the south lay in between. In contrast, the difference between the adjacent and to some extent overlapping Gaizhou Mianding and Gaizhou Manhan state farms was 0.3. The most extreme within-region difference, of course, was between Dami and the other northern populations. As we collect additional auxiliary data on the organization of specific state farm systems, we hope to understand the reasons behind such intense local variation.
Living standards may actually have been improving. Fertility appears to have been on the increase during the last half of the nineteenth century. Figure 16.3 presents cohort total marital fertility rates. The horizontal axis identifies the year in which the women of a cohort reached age 50. According to the figure, the completed fertility of women reaching age 50 fluctuated without exhibiting a trend until the 1850s. On average, married women reaching age 50 had roughly 1.75 registered sons. After a spike in the 1860s, there was a steady upward drift, so that married women reaching the end of their reproductive years in the first decade of the twentieth century had an average of nearly two sons.
Improvements were limited to the north and south. Results from event-history analysis confirm that fertility rose in the south and especially in the north between 1780 and 1888, but remained stable in the central region. Table 16.3 presents coefficients for year and logged low sorghum prices for each region from a model for the entire time period and models for the two sub-periods. According to the results for the entire time period, fertility in the north increased by about 0.3% a year.
The implication is that over a 100-year period, rates there increased by about 35.4%. Over the same period, the coefficient for the south implies that rates in that regionFigure 16.3 Cohort total marital fertility rate (16—50 sui) based on male births
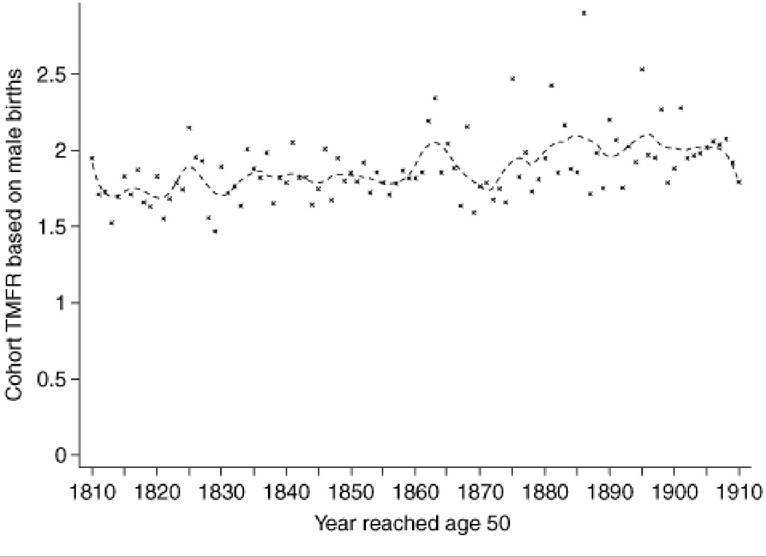
Table 16.3 Coefficients for year and logged low sorghum price from Poisson regression of number of male births in the next year for married females
| Model 1: 1780-1888 | Model 2: 1780-1834 | Model 3: 1834-88 | ||||
| Coefficient | p-value | Coefficient | p-value | Coefficient | p-valuc | |
| Year | ||||||
| North | 0.0030 | 0.00 | 0.0050 | 0.00 | 0.0087 | 0.00 |
| Central | 0.0004 | 0.49 | 0.0064 | 0.00 | 0.0051 | 0.00 |
| Daoyi | -0.0007 | 0.18 | -0.0004 | 0.82 | 0.0031 | 0.02 |
| South | 0.0008 | 0.04 | -0.0007 | 0.67 | 0.0006 | 0.54 |
| Logged low sorghum price | ||||||
| North | -0.0121 | 0.00 | -0.0394 | 0.00 | -0.0016 | 0.72 |
| Central | 0.0001 | 0.99 | -0.0244 | 0.00 | 0.0011 | 0.86 |
| Daoyi | -0.0147 | 0.00 | -0.0173 | 0.01 | -0.0204 | 0.00 |
| South | -0.0011 | 0.73 | -0.0179 | 0.00 | 0.0158 | 0.00 |
| N | 315,862 | 141,394 | 174,468 | |||
Note: The models did not include main effects of year or low sorghum price, only the interactions between them and the four dichotomous indicators of region.
To save space, coefficients for the region indicators and their interactions with the terms of the fourth-degree orthogonal age polynomial are not presented in this table. We restricted analysis to observations where the immediately succeeding observation was also available.
rose by about 8%. Examination of the coefficients for the sub-periods reveal that the overall increase in the south was the result of a jump from one time period to the next, since there were no trends within time periods, while the rise in the north stemmed from a sustained increase over both periods. There were trends within periods in the central region, but these were overwhelmed by differences between the periods.
Examination of sensitivity of fertility to grain prices yields broadly similar results, suggesting improvements in living standards everywhere but Daoyi. According to Table 16.3, between 1780 and 1834 fertility rates in all regions were sensitive to grain prices. The north was the most sensitive: a 10% increase in low sorghum prices lowered fertility rates there by 3.9% in the north. A similar price increase reduced fertility in Daoyi by 1.73% and in the south by 1.79%. In the later period, 1834—88, rates in the north were no longer affected by low sorghum prices, and rates in the south actually exhibited a positive association with prices. Rates in Daoyi, meanwhile, were as sensitive to prices as ever, if not more so.
4.2