Economic Fluctuations and Mortality—Analogies and Territorial Differences
A desegregated approach is of particular importance when using panel data for the forty-three agrarian regions and the eight urban areas. Using a cross-sectional time-series model with random effects,11 we found (for the total population and each age group) results largely consistent (in terms of lag effects and statistical significance) with those obtained with the DLM (Table 13.3).12 Moreover, we can now appreciate the significant effect of the panel-level (region/area) standard deviation: the fraction of variance due to regional heterogeneity is equal to 93%.
This was to be expected,given not only the large difference between urban areas and rural regions, but also in particular the high heterogeneity observed within the same rural territory. Indeed, the variance rate due to regional heterogeneity is still high (89%) even if we drop the eight urban areas from the analysis.
Before passing on to a detailed analysis of the results for the forty-three agrarian regions under examination, a consideration of the short-term relationship between economic variables and mortality in the urban and rural populations is of great interest. The results of this analysis, conducted using a method entirely analogous to that used for the whole population, are summarized in Table 13.4. For the urban population, the values obtained by introducing a dummy into the model to signal the epidemic of 1835 are also reported. Some urban centres, Livorno in particular, were affected by a localized, though acute, cholera epidemic, which, as is well known, especially affected the adult population (Betti 1857).
The values for the rural population do not differ greatly from those observed for the whole region (Table 13.3). Furthermore, the population of the forty-three agrarian regions represents three-fourths of that of the whole of Grand Duchy.
The oscillations in economic variables seem to have had a heightened effect on population mortality among the rural population, both adults and the elderly. This confirms, once more, the absence of any influence of prices on infant mortality (q0) while, as we have already seen, there seems to be a delayed effect on children (q1-4).The picture is less clear for the urban population. The adult and elderly populations were the sole groups to feel the consequences of the time-limited economic downward period once the epidemic of 1835 (which occurred, among other things, during a period of falling prices) was brought under control. As with the rural population, an immediate increase (lag 0) is evident in relative death rates. The mortality of the younger population seems entirely indifferent to the oscillations in economic variables. We must, however, bear in mind that the measurement of infant mortality in the urban context is problematic due to the presence of institutions for the care of abandoned babies. In the capital, the number of births was swollen by more than a fifth due to the presence of abandoned infants, mostly belonging to families from the countryside. At the same time, more than a few Florentine children died outside the city, due to the contemporary practice of sending babies and those still breastfeeding to a wet nurse in the countryside.13
Over this brief period at least, the population of the principal cities and the rural population of Tuscany would seem, therefore, to react in similar ways.
This result was also observed when limited to total adjusted deaths, throughout the entire period 1823—1934 (Breschi and Gonano 1998). Furthermore, preliminary analyses conducted by Scalone (2002) on the urban centres of Bologna and Ravenna and the surrounding rural regions seem to confirm certain homogeneity in the reactive behaviour of these two population groups (Table 13.2). This relative homogeneity with regard to demographic behaviour seems to diminish as soon as the investigation on the forty-three agrarian regions is carried out.
The presentation of the results is limited to those age groups demonstrating a greater reactivity and variability in reaction at the territorial level.Table 13.4 Estimated elasticity of wheat price fluctuations on different mortality indicators by age, rural and urban Tuscany 1823-54
| Adj. R2 | Constant | Lag 0 | Lag 1 | Lag 2 | Total lag | D. epid. | |
| Rural Tuscany | |||||||
| Total adj. deaths* | 0.29 | 0.530” | 0.248" | -0.210 | 0.438... | 0.476*** | — |
| qo | -0.01 | 1119*** | -0.123 | 0.001 | — | -0.121 | — |
| 4q | 0.19 | 0.633” | 0.103 | -0.350 | 0.618*** | 0.371* | — |
| 4-20 | 0.14 | 0.403 | 0.231 | -0.138 | 0.508.. | 0.601* | — |
| d 20-60 | 0.43 | 0.283" | 0.370” | -0.003 | 0.365.. | 0.731*** | — |
| 4o÷ | 0.38 | 0.438" | 0.377... | -0.025 | 0.220 | 0.572*** | — |
| Urban Tuscany | |||||||
| Total adj. deaths* | 0.05 | 0.642” | 0.181 | 0.044 | 0.138 | 0.364* | — |
| q | 0.27 | 0.888” | 0.057 | 0.057 | — | 0.114 | — |
| ⅜ | 0.01 | 0.812” | -0.06 | 0.220 | 0.035 | 0.193 | — |
| d | 0.09 | 0.438 | 0.133 | 0.413 | 0.030 | 0.576** | — |
| dL-60 | 0.02 | 0.728” | 0.131 | 0.055 | 0.091 | 0.277 | — |
| 4 | 0.09 | 0.663” | 0.214 | -0.125 | 0.252 | 0.341* | — |
| Urban Tuscany (with dummy epidemic) | |||||||
| Total adj. deaths" | 0.28 | 0.524” | 0.265" | 0.010 | 0.199 | 0.475** | 0.283*** |
| q | 0.39 | 0.870” | 0.082 | 0.047 | — | 0.127 | 0.130* |
| 4q | 0.02 | 0.716*** | 0.007 | 0.188 | 0.088 | 0.283 | 0.229 |
| d5-20 | 0.27 | 0.309 | 0.221 | 0.365 | 0.109 | 0.696** | 0.333*** |
| d 20-60 | 0.47 | 0.567” | 0.243" | -0.012 | 0.195 | 0.426** | 0.431*** |
| 0.29 | 0.544” | 0.302" | -0.157 | 0.307* | 0.452*** | 0.266*** | |
"Total adjusted deaths to eliminate the demographic effect of fluctuations in births. Note: Level of significance:
*** 1%,
** 5%,
, 10%.
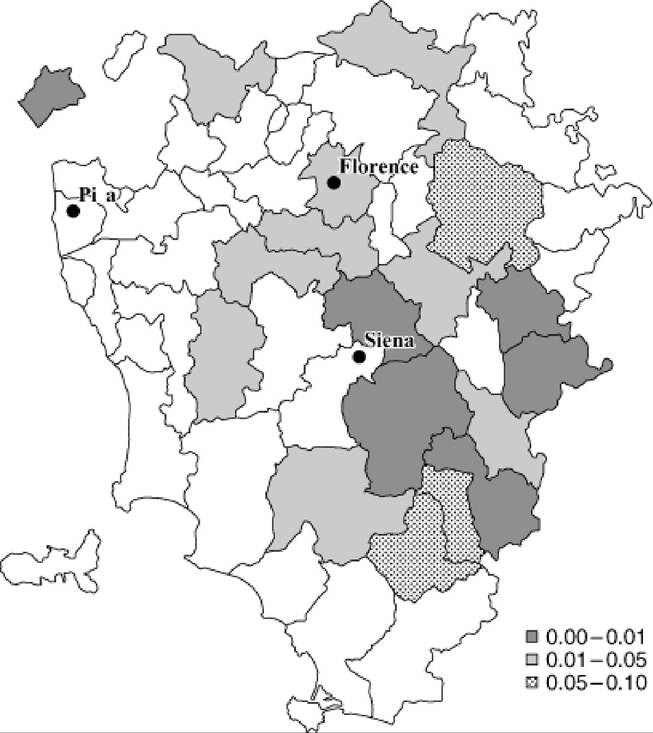
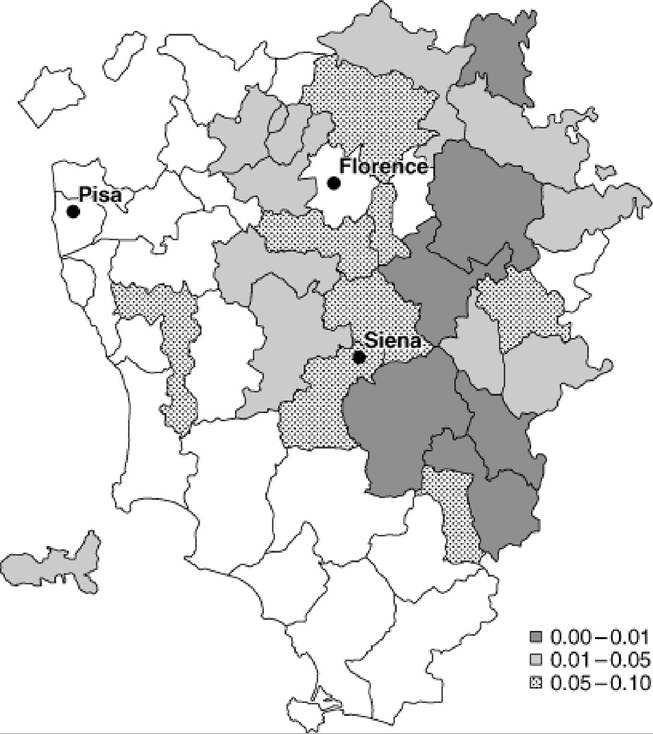
Figures 13.4—13.6, depicting the significance level of the estimated coefficients,’4 support our view with regard to the territorial distribution of the mortality response to wheat price fluctuations.
The relationship is significant in the ‘Tuscany of the river' region and in the Senese area, while it is very low, or almost absent, in the other areas. On the other hand, the inhabitants of the mountains or the Maremma marshes were less dependent on cereals, due to both alimentary consumption and access to the market. These two territories, although largely opposite in terms of their characteristics, shared certain forms of cultivation, since both had large areas of meadow and pasture. There were more animals for breeding and diary produce than in the territories of intensive cultivation, where cattle were used to work the land (Pazzagli 1992).If we focus our analysis solely on the area of the river basin and the Senese area, the results suggest that we are faced with three dichotomies. First, a demographic one, showing different behaviour according to the age groups of adults and children (q1^4); second, a chronological one, which contemplates the reactions at lag 0 and lag 2; and finally, a less evident, territorial one, setting the area of mixed cultivation against single-crop cultivation.
Figure 13.4 Adult deaths (√2060). DLM, significance level—lag 0
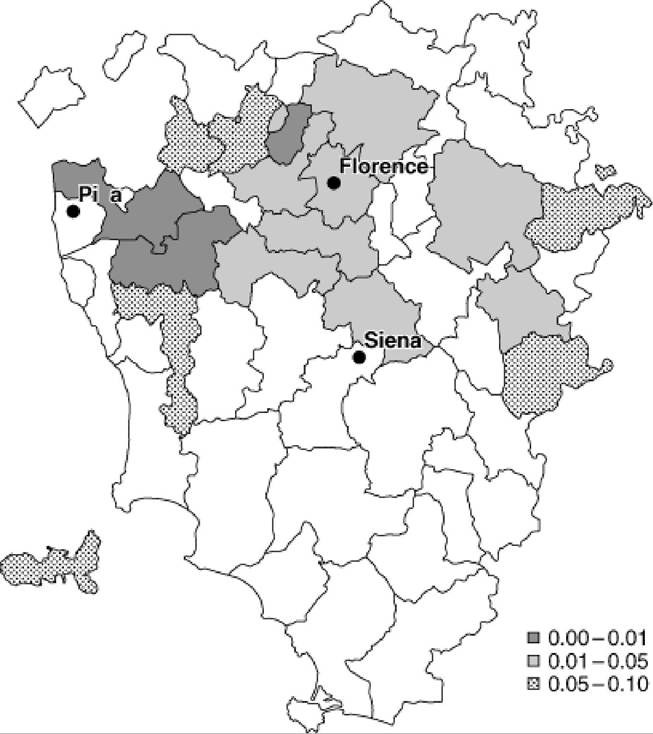
Figure 13.5 Adult deaths (4„«)- DLM significance level—lag 2
We will now try to explain how the events took place, following a chronological order.
As the wheat prices rose, the immediate reaction in terms of mortality (lag 0) is most evident in the territory of mixed cultivation; that is, in the richest area of Tuscany. In this case, the people mostly at risk were the adults, followed by the elderly.
This is a well-known mechanism. The price rise corresponded to the decrease of the immediate availability of grain and, at the same time, access to the market became more difficult.
The most seriously affected areas were those with a high population density, with olive trees and vineyards. These areas had a very low surplus of grain, if not a negative one, and a relatively high number of people had to rely on the market to acquire the cereals they needed (Biagioli 1991; Pazzagli 1992).It should be pointed out that in some territories of mixed cultivation, such as the pasture regions, sharecroppers had diversified their incomes and therefore had access to a wider variety and choice of alimentary goods. Frequently, however, this was not the case. The sharecroppers' families were often in debt to the landowner; if they could use part of their best produce—olives and grapes—it was only to reduce the debt, certainly not to better their diet (Giorgetti 1974). The greater market
Figure 13.6 Child mortality rates (q1-4). DLM, significance level—lag 2
dependence of the population from the ‘Tuscany of the river' basin is explained, as we have often mentioned, by the more consistent presence of the poor, the farm labourers, and the wage earners in the countryside, and the high number of people residing in the urban centres.
The solar year following an increase in prices displays an evident negative correlation between wheat price and mortality, although with low intensity, in various agrarian regions and across all age groups (except infants). Such results can be explained by the fact that, after a period of time marked with an increase, mortality generally decreased since the weakest tended to be the most vulnerable initially.
We observe another increase in mortality during the following year (lag 2), although this time the consequences weigh more heavily upon children aged from one to five than upon adults. The agrarian areas most affected are not the same as those at lag 0. At lag 2, in fact, the areas of mixed cultivation are largely saved, while the effect of a price oscillation on death rates in the age group 1—4 (q1J is particularly evident in the area of single-crop cultivation, ‘the land without the harmony of trees'.
How can we explain such an apparent anomaly? In the Senese area and more widely over the whole of the south-eastern part of Tuscany, agriculture was poorer than in the north. However, the production of cereals was sufficient for a small population, even in times of scarcity (Pazzagli 1992: 210). As the volume of produce decreased, subsistence appears to have been still guaranteed, since we do not notice an increase in mortality.
In this area, however, traditional sharecropping regulated production relations in the countryside, and the economy as a whole was less developed. The portion of produce that was consumed by the farmers' families was usually higher, and relations with the market were consequently rare. Therefore, as the price increase diminished incomes, it also made the rural population more dependent on the market for the diversification of their diet. It thus is likely to have worsened quality of life, although in a limited way.
It should be added that, because of either the price increase or the need to overcome the poor summer produce, the sharecropper was inclined to intensify cereal production. This possibility existed in the geographical area of single-crop cultivation where a system of agrarian rotation allowed for a quarter, or even a third of the land to be left fallow. It might be that in the most difficult years fallow lands were cultivated, or that a second harvest was attempted with a consequent production of a spring cereal after a winter one. Moreover, the same crop was sometimes cultivated in the same field for two consecutive years, meaning that the rhythm of rotations could be intensified, and causing an impoverishment of the land. A reaction of this type would have merely delayed the negative consequences of a bad harvest, inducing a cycle of poor harvests rather than avoiding them altogether.
A rise in mortality among adults has the effect of increasing the number of orphans, the group most at risk (Breschi and Manfredini 2002). This factor probably condemned many youngsters, but it was not the only one: children could remain alone for other reasons as well. As the land for cultivation increased in the years immediately following the crisis, so did the demand for workers. The consequence was a longer absence of womenand mothers—from their homes. The situation was made worse when another child was born in the family. In this case, a period of economic difficulty started a form of competition among the children, causing an increase in mortality of younger children (Breschi and Derosas 2000; Breschi, Derosas, and Manfredini 2000).
Of course we are still making hypotheses but, for certain, the price of lower mortality incurred during the year zero had to be paid eventually Adults did pay their toll, but those who paid mostly dearly were the children; that is, the ones who initially seemed to have gained most.
6.