Eastern Japan
There is a set of Edo builders' real wage series covering the 1830-94 period. These series, probably the most widely quoted wage series for Japan, were estimated by Yoko Sano more than forty years ago.
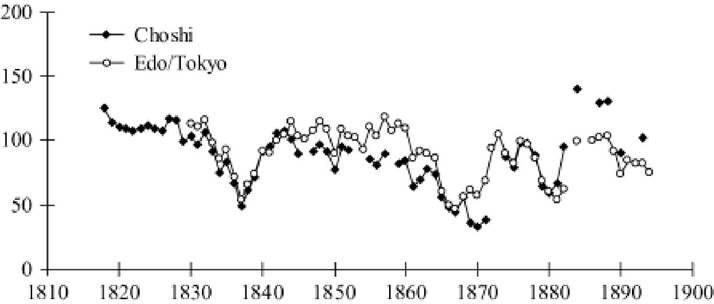
The data source she utilized was a table of daily money wage rates for six occupations in Edo/Tokyo's building trades, that is, carpenters, masons, tatami makers, joiners, thatchers, and sawyers. The dataset was compiled in the Meiji period by the Chamber of Commerce, who asked guild officers and old men in the trade to collect data retrospectively Probably because of this method of data collection, there are sudden jumps and drops in the wage series of individual trades and the number of jumps exceeds that of drops, thus producing a possible upward bias. Sano, however, made no adjustments to the data. Some of the upward spikes in the carpenter series in the 1850s and the early 1870s were spotted by Williamson (1998: 39). He replaced them with figures derived by interpolation but failed to purge other aberrations, so that the series still shows a slightly upward trend from 1830 to the early 1860s. In fact, more serious than single-year spikes are cases where the overall level jumped upward or downward abruptly. A check on the six nominal wage series reveals that there was no synchronization of such abrupt changes from one occupation to another. In order to remove these aberrations, I therefore took the following steps: first, all the six rates of nominal wage change were calculated from year one to year two; second, the highest and the lowest ones were removed; third, the remaining four were averaged; finally, the average was linked to the similarly calculated rate of change from year two to year three, and so on, producing a series of average nominal wage rates for the building trade from 1830 to 1894. This nominal series with the base year of 1840-4 was deflated by the new consumer price indices for Edo/Tokyo derived from Saito (1998: 189-92). The results are reported in Appendix Table 3.A2.Figure 3.3 shows this graph. Note that it no longer exhibits an upward trend during the period up to the early 1860s, which was a feature of both the Sano and Williamson series, and that the series trends upwards, though feebly, after the
Figure 3.3 Two series of craftsmen's real wages: the Kanto, 1818-94 (1840—4—100)
Source. Appendix Table 3.A2.
late 1860s. While this is an improvement over previous indices, errors may still remain. Fortunately, the pattern in Figure 3.3 can be verified with another new series for Choshi, a town some 90 km east of Edo, covering the period from 1818 to 1893. The town was famous for its soy-sauce manufacturing and one Choshi manufacturer's wage books allow us to construct a composite series of annual wage payments weighted by the number of workers in various skill grades. The standard composition of the workforce was one master (tδji), two head workers (kashira), and eighteen ‘lads' (wαkαmoΛθ). The weighted average of their wages, therefore, should be regarded as representing the wage level of those near the middle of the traditional work pyramid or, more generally, that of the semi-skilled. The nominal wages thus calculated are deflated by the same Edo/Tokyo consumer price series, set out in Appendix Table 3.A2 and shown, together with the graph for Edo/Tokyo builders' real wages, in Figure 3.3. The trends in the Choshi series are even more pronounced than in the Edo/Tokyo series: real wages declined almost continuously in the period before 1870, then turned strongly upwards.
2.3