First Things First: Differences in Early Modern Life Expectancy
The concept of living standards that most scholars will rightly favour is the broad one of lifetime resources, not resources per hour or per year. Even if one's view were confined to a monetized measure of a person's free time plus consumption of goods and services, an inquiry into living standards must start from the length of life itself—especially for early settings, in which food scarcity meant shorter life.3
What little we know about inequalities in the length of life before the early nineteenth century serves to preview what we will find about inequalities in real incomes.
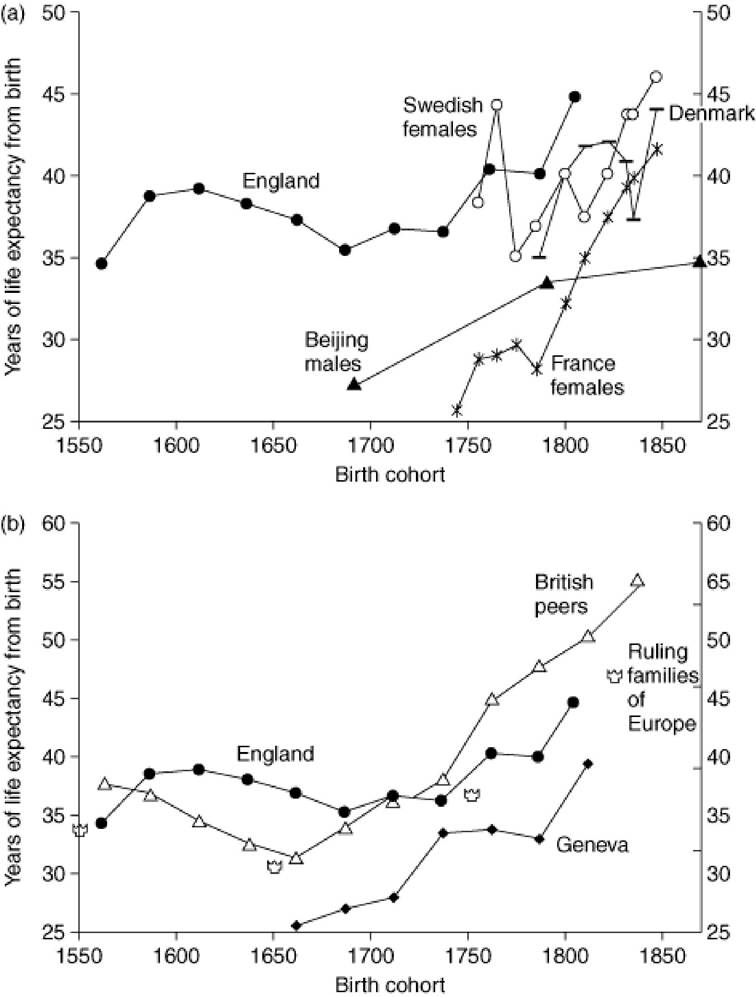
On the one hand, comparing national average life expectancies across Europe or around the globe is extremely difficult, and we cannot say much about systematic inequalities. The available estimates signal a possible global rise in life expectancies dating from the seventeenth century, but with no clear change between national average lengths of life. On the other, looking within nations, we can detect a widening of inequalities, in this case within western European countries in the eighteenth century.Direct estimates of national average life expectancy before the mid-nineteenth century are concentrated in the seven countries whose experience is summarized in Table 6.1 and Figure 6.1. The advance of English life expectancy as mapped by the Cambridge Group for the History of Population and Social Structure makes the best baseline for comparison with other groups and nations. That English series showed some improvement in life expectancy from the mid-sixteenth century to the early seventeenth, then a century of retreat to the old mortality, and finally a sustained rise after the mid-eighteenth century. The improvement after the mid-eighteenth century looks stronger and certain in writings since the original estimates were presented in the path-breaking Wrigley-Schofield volume in 1981.
The Cambridge Group's new reconstitution volume seems to show a stronger rise after 1750, in line with the suggestions raised by Razzell and others (Razzell 1994, 1998, 1999, forthcoming; Wrigley et al. 1997).No other national population represented in Table 6.1 and Figure 6.1 seems to have lived longer than the English did. Even around 1750, at the start of the great lengthening of English life, only the estimates for Sweden seemed to match the English,4 and Sweden fell behind thereafter. As for China, a central interest in this volume, we have two straws in the wind. On the one hand, the available quantitative estimates like those for Beijing men in Table 6.1 and Figure 6.1 show shorter life spans in a few Chinese localities. On the other, Pomeranz has argued that we really cannot tell that Chinese populations died younger than Europeans (Pomeranz 2000: chapter 1).
Table 6.1 Estimates of life expectancy at birth for various places and classes, 1500—1850
| Nation | Place | Socio-ec- o n o m i c classes | Time period or approx. year | Life expectancy at birth (E) | Source and comments | ||
| Males | Females | Both | |||||
| Belgium | Sart | All | 1811-45 | — | — | 39.4 | Oris, Alter, and Neven (in this volume Chapter 15) |
| China | Anhui | All | 1300-18 00 | 31.0 | 26.0 | 28.6 | Lee and Wang (1999: 54-5) |
| China | Beijing | All, urban | 1644-17 39 | 27.2 | 24.6 | 25.9 | Lee and Wang (1999: 54-5) |
| China | Beijing | All, urban | 1740-18 39 | 33.6 | — | — | Lee and Wang (1999: 54-5) |
| China | Beijing | All, urban | 1840-99 | 34.7 | — | — | Lee and Wang (1999: 54-5) |
| Denmark | Nation | All | 1780-9 | 34.0 | 35.9 | 34.9 | Andersen (1984: 125) |
| Denmark | Nation | All | 1790-9 | 39.4 | 41.5 | 40.4 | Andersen (1984: 125) |
| Denmark | Nation | All | 1800-9 | 40.4 | 43.3 | 41.8 | Andersen (1984: 125) |
| Denmark | Nation | All | 1810-19 | 40.8 | 43.6 | 42.1 | Andersen (1984: 125) |
| Denmark | Nation | All | 1820-9 | 40.0 | 41.9 | 40.9 | Andersen (1984: 125) |
| Denmark | Nation | All | 1830-9 | 36.4 | 38.3 | 37.3 | Andersen (1984: 125) |
| Denmark | Nation | All | 1840-9 | 43.0 | 45.2 | 44.1 | Andersen (1984: 125) |
| France | Nation | All | 1740-9 | 23.8 | 25.7 | 24.7 | Bideau et al. (1988: 236) |
| France | Nation | All | 1750-9 | 27.1 | 28.7 | 27.9 | Bideau et al. (1988: 236) |
| France | Nation | All | bgcolor=white>1760-926.4 | 29.0 | 27.7 | Bideau et al. (1988: 236) | |
| France | Nation | All | 1770-9 | 28.2 | 29.6 | 28.9 | Bideau et al. (1988: 236) |
| France | Nation | All | 1780-9 | 27.5 | 28.1 | 27.8 | Bideau et al. (1988: 236) |
| France | Nation | All | 1790-9 | — | 32.1 | — | Blayo, as cited in Bengtsson et al. (1984: 49) |
| France | Nation | All | 1800-9 | — | 34.9 | — | Blayo, as cited in Bengtsson et al. (1984: 49) |
| France | Nation | All | 1810-19 | — | 37.5 | — | Blayo, as cited in Bengtsson et al. (1984: 49) |
| France | Nation | All | 1820-9 | — | 39.3 | — | Blayo, as cited in Bengtsson et al. (1984: 49) |
| France | Nation | All | 1831-40 | — | 39.9 | — | Van de Walle, as cited in Bengtsson et al. (1984: 49) |
| France | Nation | All | 1841-50 | — | 41.6 | — | Van de Walle, as cited in Bengtsson et al. (1984: 49) |
| Germany | (?) | All | 1750-9 | — | — | 36.4 | Perrenoud (1997) |
| Prussia | Bluthen | All | 1765-18 00 | 28.4 | 36.7 | 32.6 | Hagen (2002: chap. 4) |
| Sweden | Nation | All | 1751-60 | — | 38.3 | — | Perrenoud (1997) |
| Sweden | Nation | All | 1761-70 | — | 44.3 | — | Perrenoud, in Bengtsson et al. (1984: 49) |
| Sweden | Nation | All | 1771-80 | — | 35.0 | — | Perrenoud, in Bengtsson et al. (1984: 49) |
| Sweden | Nation | All | 1781-90 | — | 36.8 | — | Perrenoud, in Bengtsson et al. (1984: 49) |
| Sweden | Nation | All | 1791-18 00 | — | 40.1 | — | Perrenoud, in Bengtsson et al. (1984: 49) |
| Sweden | Nation | All | 1801-10 | — | 37.5 | — | Perrenoud, in Bengtsson et al. (1984: 49) |
| Sweden | Nation | All | 1811-20 | — | 40.1 | — | Perrenoud, in Bengtsson et al. (1984: 49) |
| Sweden | Nation | All | 1821-30 | — | 43.8 | — | Perrenoud, in Bengtsson et al. (1984: 49) |
| Sweden | Nation | All | 1831-40 | — | 43.7 | — | Perrenoud, in Bengtsson et al. (1984: 49) |
| Sweden | Nation | All | 1841-50 | — | 46.0 | — | Perrenoud, in Bengtsson et al. (1984: 49) |
| Sweden, Scania | 4 parishes | All | 1765-18 15 | 36.2 | 35.1 | 35.7 | Bengtsson and Dribe (1997: Table 2.1) |
| Sweden, Scania | 4 parishes | All | 1815-65 | 40.2 | 41.2 | 40.7 | Bengtsson and Dribe (1997: Table 2.1) |
| Switzerland | Glaris | All | 1751-60 | — | — | 32.6 | Perrenoud (1997) |
| Switzerland | Geneva | All, urban | 1625-49 | — | — | 23.6 | Perrenoud, in Bengtsson et al. (1984: 49) |
| Switzerland | Geneva | All, urban | 1650-74 | — | — | 25.7 | Perrenoud, in Bengtsson et al. (1984: 49) |
| Switzerland | Geneva | All, urban | 1675-99 | — | — | 27.1 | Perrenoud, in Bengtsson et al. (1984: 49) |
| Switzerland | Geneva | All, urban | 1700-24 | — | — | 28.3 | Perrenoud, in Bengtsson et al. (1984: 49) |
| Switzerland | Geneva | All, urban | 1725-44 | — | — | 33.8 | Perrenoud, in Bengtsson et al. (1984: 49) |
| Switzerland | Geneva | All, urban | 1745-69 | — | — | 34.0 | Perrenoud, in Bengtsson et al. (1984: 49) |
| Switzerland | bgcolor=white>GenevaAll, urban | 1770-90 | — | — | 33.2 | Perrenoud, in Bengtsson et al. (1984: 49) | |
| Switzerland | Geneva | All, urban | 1800-25 | — | — | 39.7 | Perrenoud, in Bengtsson et al. (1984: 49) |
| UK | England | All | 1550-74 | — | — | 34.5 | Wrigley and Schofield (1981: Table A3.1) |
| UK | England | All | 1575-99 | — | — | 38.7 | Wrigley and Schofield (1981: Table A3.1) |
| UK | England | All | 1600-24 | — | — | 39.1 | Wrigley et al. (1997: 295) |
| UK | England | All | 1625-49 | 38.7 | 37.6 | 38.2 | Wrigley et al. (1997: 295) |
| UK | England | All | 1650-74 | 38.1 | 36.3 | 37.2 | Wrigley et al. (1997: 295) |
| UK | England | All | 1675-99 | 35.4 | 35.4 | 35.4 | Wrigley et al. (1997: 295) |
| UK | England | All | 1700-24 | 36.6 | 36.8 | 36.7 | Wrigley et al. (1997: 295) |
| UK | England | All | 1725-49 | 35.8 | 37.4 | 36.6 | Wrigley et al. (1997: 295) |
| UK | England | All | 1750-74 | 40.7 | 40.0 | 40.4 | Wrigley et al. (1997: 295) |
| UK | England | All | 1775-99 | 40.8 | 39.5 | 40.2 | Wrigley et al. (1997: 295) |
| UK | England | All | 1800-9 | — | — | 44.8 | Wrigley et al. (1997: 295) |
| UK | Britain | Peers | 1550-74 | 37.8 | 38.2 | 38.0 | Hollingsworth (1977: birth cohorts) |
| UK | Britain | Peers | 1575-99 | 36.0 | 38.3 | 37.1 | Hollingsworth (1977: birth cohorts) |
| UK | Britain | Peers | 1600-24 | 33.6 | 35.9 | 34.7 | Hollingsworth (1977: birth cohorts) |
| UK | Britain | Peers | 1625-49 | 31.7 | 34.2 | 32.9 | Hollingsworth (1977: birth cohorts) |
| UK | Britain | Peers | 1650-74 | 30.0 | 33.7 | 31.8 | Hollingsworth (1977: birth cohorts) |
| UK | Britain | Peers | 1675-99 | 33.2 | 35.3 | 34.2 | Hollingsworth (1977: birth cohorts) |
| UK | Britain | Peers | 1700-24 | 34.9 | 37.5 | 36.2 | Hollingsworth (1977: birth cohorts) |
| UK | Britain | Peers | 1725-49 | 38.8 | 37.4 | 38.1 | Hollingsworth (1977: birth cohorts) |
| UK | Britain | Peers | 1750-74 | 44.6 | 45.9 | 45.2 | Hollingsworth (1977: birth cohorts) |
| UK | Britain | Peers | 1775-99 | 46.9 | 49.2 | 48.0 | Hollingsworth (1977: birth cohorts) |
| UK | Britain | Peers | 1800-24 | 49.3 | 51.9 | 50.5 | Hollingsworth (1977: birth cohorts) |
| UK | Britain | Peers | 1825-49 | 52.2 | 58.4 | 55.2 | Hollingsworth (1977: birth cohorts) |
| Europe | Ruling families | 1500-99 | 32.1 | 36.0 | 34.0 | Peller (1965: 98) | |
| Europe | Ruling families | 1600-99 | 28.1 | 33.7 | 30.8 | Peller (1965: 98) | |
| Europe | Ruling families | 1700-99 | 36.1 | 38.2 | 37.1 | Peller (1965: 98) | |
| Europe | Ruling families | 1800-49 | 45.9 | 48.1 | 47.0 | Peller (1965: 98) | |
‘ The expectancy for both sexes is calculated as (0.516 male E0)+(0.484 female E0) in most cases here.
Figure 6.1 Life expectancy at birth, 1500—1850
Any comparisons beyond the few countries in Table 6.1 and Figure 6.1 are covered in statistical darkness. For any country outside of western Europe, and for many within western Europe, we still do not know how mortality changed. Thus, Pomeranz's valid doubt about shorter life spans in China rests on the scarcity of data.
To get an indirect sense of how mortality compared across countries and regions, some have tried to supplement direct estimates of national average life expectancy with indirect reasoning based on the rate of population growth. That rate must equal the crude birth rate plus the immigration rate minus the crude death rate. If we know that some other regions had faster population growth than western Europe without having higher birth rates or more net immigration, then they must have had lower death rates. If this contrast continued for a century or longer, one could use the lower death rate as a sign of lower age-adjusted mortality.
As it happens, some areas did have faster population growth than England or western Europe as a whole between 1500 and 1800. China's population grew as fast as England's, and faster than that of western Europe (McEvedy and Jones 1978; Wrigley et al. 1997; Lee and Wang 1999). So did the population of Russia. Asia as a whole grew as fast as western Europe as a whole. In the case of China, at least, one could further argue that the total fertility rate was not higher than in Europe, suggesting that its faster population growth must have owed something to a lower death rate (Lee and Wang 1999: 67—99). Yet, even this inference requires assumptions about how many west Europeans emigrated to the Americas between 1500 and 1800. In general, then, we are still in doubt about the superior life expectancy of the English, and especially about any longer life for western Europe as a whole, for any time before 1800.
Looking within countries, one can be a little more certain about inequality trends in life expectancies than one can about contrasts between national averages. In general, the top socio-economic classes and their children lived longer after 1750. Genealogical studies show us that the British peers' family members began surviving longer than the national average by 1750 or a little earlier (Table 6.1 and Figure 6.1). The ruling families of Europe did not fare as well as British peerage families, but their survival did catch up with the English national average in the eighteenth century, which apparently gave them longer life than the averages for continental countries. Similarly, the eighteenth century also brought better survival chances for infants of middle- and upper-class parents in England, France, and Geneva. Before r.1750, being born into a top-class family had an uncertain average effect on longevity. A child born to a high family among British peers, or in the ruling families of Europe, did not have a clear advantage over the average English newborn. On the other hand, wives of French notables had better adult survival rates than local commoners had, at least as far back as 1700—39, and the families of notables in Geneva lived longer as far back as 1625—44 (Perrenoud 1975, 1997; Bideau et al. 1988; Razzell 1998, 1999, forthcoming).
Thus within the nations of western Europe, the reigning suggestion—or guess—is that life spans were correlated with socio-economic class after 1750, or perhaps earlier.5 This correlation suggests that inequality was at least as great across the major income classes over their whole lifetimes as it was in annual income terms, starting around 1750 or earlier.
4.