Demographic indicators of standard of living
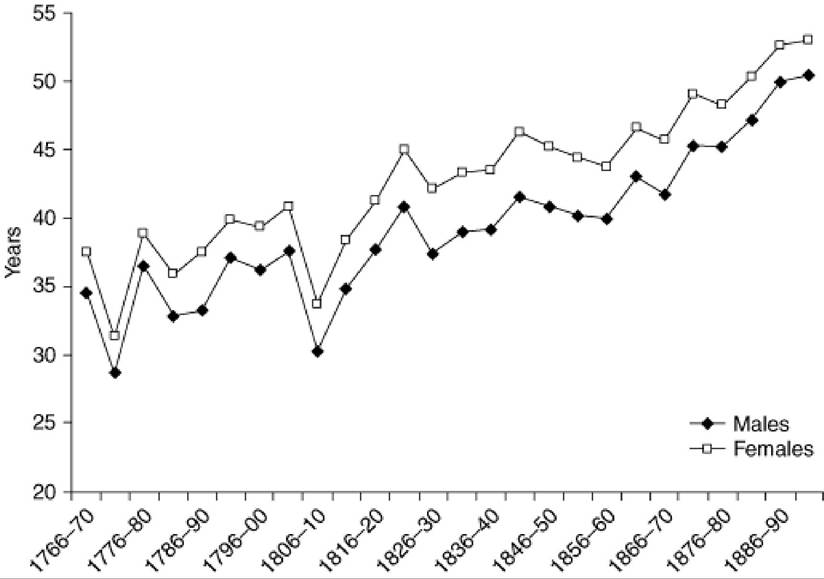
Figure 14.2 reports the period life expectancy at birth (e0) in Sweden from 1766/70 to 1891/95. The second half of the eighteenth century shows no clear trend. In the
Figure 14.2 Life expectancy at birth (e0) in Sweden, 1766/70-1891/95
Source.
Berkeley Mortality Database, Department of Demography, University of California, Berkeley. http:/demog. berkeley.edu/wilmoth/mortalityyears 1772-3 and 1808-9 life expectancy dropped quite dramatically due to widespread famine following severe harvest failures (1771-2) and epidemics (e.g. typhus) during the Finnish War (1808-9) (Hofsten and Lundstrom 1976: 47). After 1810 life expectancy increased until the early 1820s, followed by a stagnation or very weak increase, between the late 1820s and the late 1850s. After 1860 life expectancy increased steadily for the rest of the nineteenth century. Broadly speaking, this development seems to agree fairly well with the real wage development pictured in Figure 14.1. Until around 1810 real wages declined slightly followed by an increase until the mid-1820s, after which comes a period of stagnation before the continuous increase starts in the mid-1860s. Thus, it appears as if both the economic and demographic indicators show a similar development: some improvement in the beginning of the nineteenth century, stagnation during the period of agricultural transformation and steady increase after the 1860s. For Malmohus County the development seems to deviate slightly from the early nineteenth-century real wage improvements, otherwise it looks quite similar.
The increased life expectancy can to a large extent be accounted for by the dramatic decline in infant and child mortality from the late eighteenth century onwards. Adult mortality shows an increasing tendency during the late eighteenth century but then starts to decline in the first decades of the nineteenth century and after about 1850 declines more rapidly (e.g Statistics Sweden 1999: 116).
In the late 1840s and the early 1850s child mortality (ages 1-14) turned upwards again, quite substantiallyFigure 14.3a Age-specific death rates for male children (1—14 years) in Sweden, 1766/70—1891/95
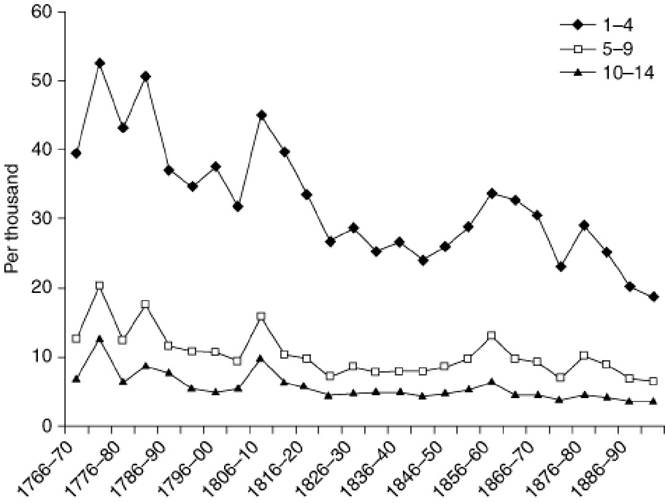
Figure 14.3b Age-specific death rates for female children (1—14 years) in Sweden, 1766/70—1891/95
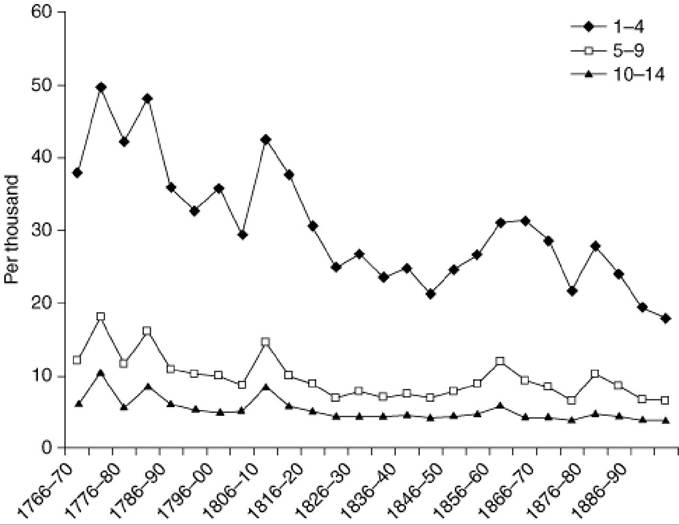
but only temporarily, as shown in Figure 14.3(a) and (b). Sandberg and Steckel (1988) have argued that this increase was largely caused by typical ‘children's diseases,' whose causes are known to be related to nutrition, for instance, measles, whooping cough, and dysentery (see also Hofsten and Lundstrom 1976: 47-9; Rotberg and Rabb 1985: 305-8). This led them to conclude that the nutritional status of children probably declined during this period (Sandberg and Steckel 1988). Fridlizius, however, questioned this conclusion, arguing that most of the increase in child mortality during this period was caused by diseases related only weakly to nutrition, or not at all: scarlet fever, diphtheria, and croup, while measles and whooping cough show roughly the same frequency as before (Fridlizius 1989). Thus, although child mortality unquestionably increased during the late 1840s and the 1850s, it still remains unclear to what extent this was related to changes in nutrition.
2.5