A Close Focus on Wages and the Labor Income Share
As stated by several European leaders and institutions, one of the main policies to be implemented in order to exit the economic slowdown concerns the labor market, with particular reference to wage competitiveness.
These policies have as their central pillar flexibility of labor, contracts and salaries. Also in this case, as in the case of the fallacious idea that austerity leads to growth, the labor policy has been based on an erroneous idea: an increase in employment could be achieved only if labor protection and rights were transferred from those who have them to those who have none. Where these policies were applied, the major result has been to reduce the number of protected workers without adding protection for nonprotected workers. However, not only protection and rights have been adversely affected, but also wages themselves have suffered, both for insiders and outsiders. Nominal wages have been squeezed and real wages decreased (Janssen, 2014). The latter have not even kept pace with the weak productivity growth, resulting in a further decrease in the share of labor income. The two figures 15.1a and 15.1b show the change in the labor income share distribution since the year 2000 in two distinct periods: the years before the crisis and the years during the crisis, with a projection to 2015 based on the latest OECD forecast for 2014 and 2015. As is evident, in many countries the labor income share has deteriorated substantially during the crisis and particularly in the European countries that have had to adopt the heaviest internal rulings on competitive devaluation on wages: Greece, Spain, Ireland and Portugal. Out of the PIIGS, only Italy has reduced its fall in the labor income share, which showed a slight recovery in the precrisis years (+3 percentage points), compared to the disastrous fall during the '90s (-10 percentage points of loss in one decade) (Pini, 2013a), but this precrisis recovery was more than lost with the crisis. For G20 countries, the gap between real wages and productivity has increased since 1999 and shows an upswing after 2008-9 given the stagnation of real wages.The lesson is clear. The reduction in employment and the parallel reduction or very low increase of real wages both contribute to reducing the labor income share, and this, in turn, reduces internal consumption and internal aggregate demand, worsening, through short-sighted policies, the effect of the ongoing economic crisis.
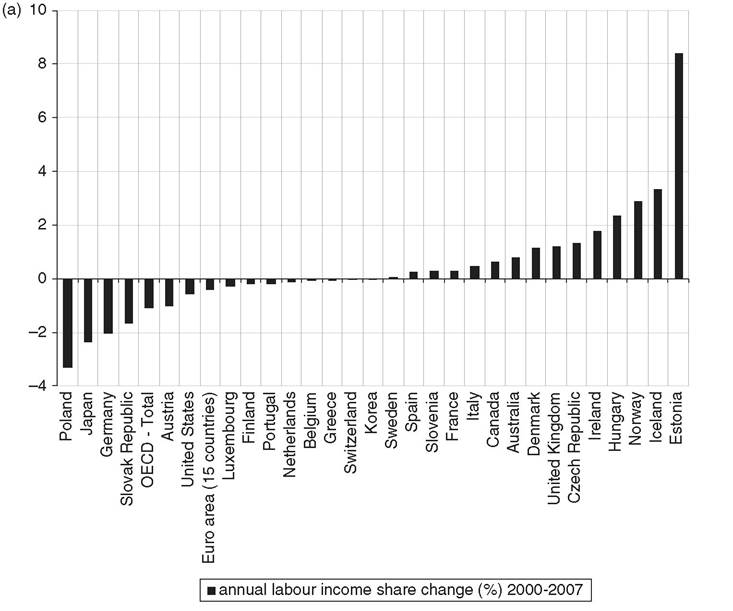
Figure 15.1a Annual change in labor income share 2000-7.
Source: Elaboration on OECD.Stat, OECD Economic Outlook: Statistics and Projections, May 2014.
When we look at the nominal unit labor cost as a measure of cost competitiveness, we notice that notwithstanding the compression of nominal wages in many countries, after 2005 and particularly during the crisis, competitiveness does not improve at all (figures 15.2 and 15.3a-15.3e). Only in Greece, Ireland and Spain has the dramatic decline in wages produced a strong control of unit labor cost, while in other countries, except Japan (with negative change), the index even increases during the crisis. For Portugal data are not available. In Eastern European countries, the index is expected to increase from 1 to 1.1-1.35 (except Estonia, which is a case apart). Most industrialized countries show a similar trend (from 1 to expected 1.1-1.25), with Canada and the United Kingdom faring best (over 1.25), and France, the United States and Germany (1.15) just below Italy (1.2). Japan, where a strong wage decline has been associated with productivity stagnation for a long time, is a case apart. This performance is the result of low productivity growth after 2005 and in particular during the crisis period.
This policy of wage deflation does not seem to help competitiveness or growth. Instead, it produces two effects. On the one hand, it restrains the internal demand
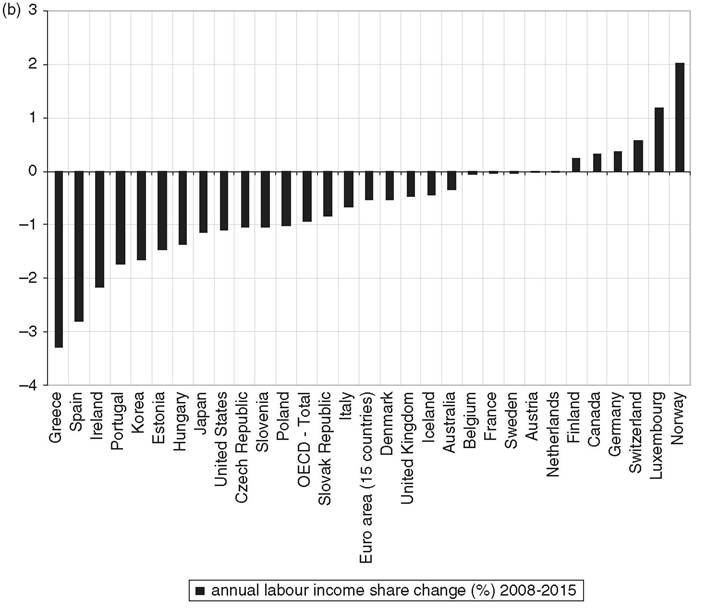
Figure 15.1b Annual change in labor income share 2008-15.
Source: Elaboration on OECD.Stat, OECD Economic Outlook: Statistics and Projections, May 2014; for 2014 and 2015, OECD forecasting.
originating from labor income, worsening the recessive effects of fiscal expansionary austerity. On the other, it does not encourage competitiveness given that because of scale effects (reduced production) and substitution effects (cheaper and less productive labor) productivity is stagnant throughout Europe.4
Despite this, the European Commission's (EC) country-specific recommendations prescribe flexibility policy on contracts and wages in the labor market to increase wage competitiveness.5 Growth is entrusted to foreign demand, even if in Europe it counts for no more than 20 percent of total demand, whereas the remaining 80 percent is internal demand, family consumption, private and public investment and public services. In order to sustain the first, the EC demands greater coordination in symmetrical fiscal policy, even if this restrains the second, with depressive effects on income and employment, and a deterioration of the debt/GDP ratio for all European countries.
Wage competitiveness is thought to be the pillar to reach this goal, via unit labor cost reductions to support firms in global markets. Interventions are focused on reductions
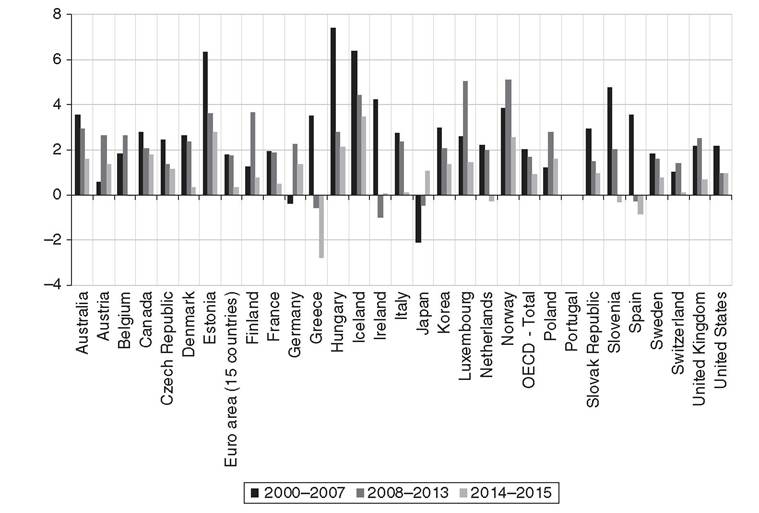
Figure 15.2 Unit labor cost (growth rates).
Source: Elaboration on OECD.Stat, OECD Economic Outlook: Statistics and Projections, May 2014.
in collective bargaining (national and sectorial) and on nominal wages, which instead should be aligned to firm productivity, even to single worker effort. For real wages, every mechanism such as indexation to preserve workers’ purchasing power must be dismantled, because they must respond only to market conditions, where hiring and firing should accommodate the production needs of companies, without interference due to institutions and legal constraints that slow down managerial reactions to asymmetrical shocks and create barriers between protected workers, insiders, and nonstandard labor force, or outsiders.
In other words, following this vision, precarious work and unemployment are the other side of the coin hampered by collective institutions: when these are dismantled, even precariousness and unemployment will magically disappear. This is very well-known storytelling, increasingly appealing to economic techniques explaining that the largest and increasing share of unemployment is structural-voluntary unemployment, with very little space left for cyclical-involuntary unemployment, in order to prove that aggregate demand is not a problem at all. Only the supply side counts, so the need for structural reforms of the labor market is the only refrain in political debate. It is an old tale renewed with new technicalities that takes us straight back to the ancien regime.6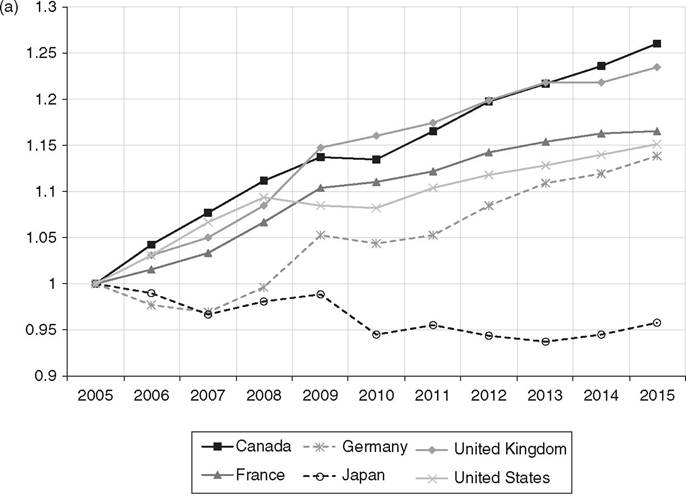
Figure 15.3a Unit labor cost index (Canada, France, Germany, Japan, United States,
United Kingdom)
Source: elaboration on OECD. Stat, OECD Economic Outlook: Statistics and Projections, May 2014.
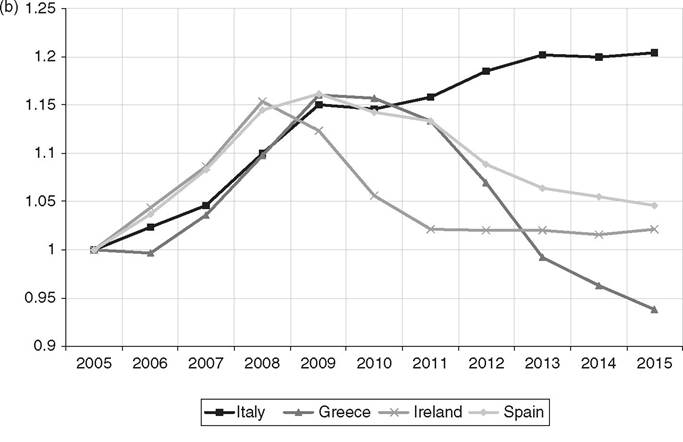
Figure 15.3b Unit labor cost index (Italy, Greece, Ireland, Spain).
Source: Elaboration on OECD.Stat, OECD Economic Outlook: Statistics and Projections, May 2014.
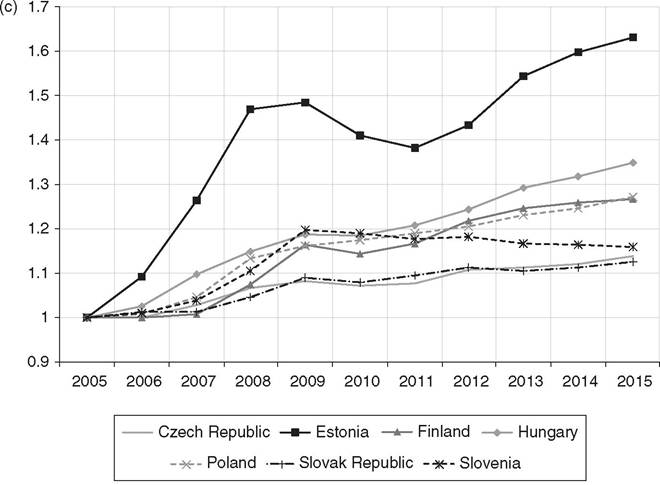
Figure 15.3c Unit labor cost index (Czech Republic, Estonia, Finland, Hungary, Poland, Slovak Republic, Slovenia).
Source: Elaboration on OECD.Stat, OECD Economic Outlook: Statistics and Projections, May 2014.
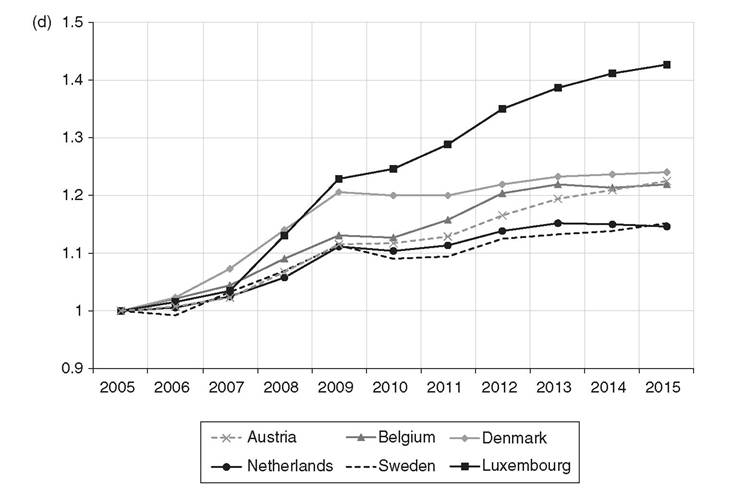
Figure 15.3d Unit labor cost index (Austria, Belgium, Denmark, Netherlands, Sweden, Luxembourg).
Source: Elaboration on OECD.Stat, OECD Economic Outlook: Statistics and Projections, May 2014.
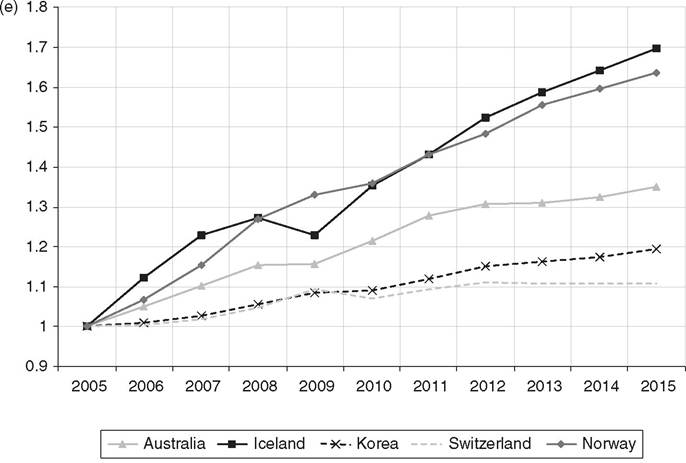
Figure 15.3e Unit labor cost index (Australia, Iceland, Korea, Switzerland, Norway).
Source: Elaboration on OECD.Stat, OECD Economic Outlook: Statistics and Projections, May.
2.