Cheaper luxuries, greater divergence between nations
A second point about income—class differences in spending patterns also suggests that we may have understated the rise in global inequality before the 1820s. It is very likely that luxury goods became cheaper relative to staple foods over most of the period from 1500 to 1820.
Part of the cheapening took the form of consumer gains from new luxury goods. This early modern phenomenon is well known (van der Woude and Schuurman 1980; Wetherill 1988; Shammas 1990; Brewer and Porter 1993; Jardine 1996). Yet its importance for real incomes is as hard to quantify for that period as it is for officials trying to introduce new goods and services into today's cost-of-living indices.9 In fact, for fashion goods, luxuries are intended to change constantly, frustrating our search for consistent time series.How can the role of new goods be quantified? There is much that can be done by working from both ends of this stretch of the path. Quantitative social historians can continue estimating the values of new consumer durables from probate inventories and other archival documents. Economists can apply new developments in index-number theory that allow us to put bounds on the consumer welfare gains from the arrival of new goods.10 While the ultimate magnitudes of the welfare gains from new goods are unknown, they presumably helped the rich more than they helped the poor.
New goods aside, the available time series on the prices of a few older goods and services show that the prices of necessities generally rose faster than the prices of other goods and services between the early sixteenth and the late eighteenth centuries. Drawing on the International Price History Project of the interwar years, one can follow the price trends of a dozen major non-staple products of consumption from 1500 or earlier through 1790 or later in a few dozen European cities and regions.
We have summarized the trends in relative or ‘real’ prices of non-staples, relative to a food grain or bread, in Table 6.3 and Figure 6.2, with fuller detail in Table 6.4. The common denominator in all these relative-price series is a staple food-grain item. The price of bread, a true consumer good, is available to play this role for regions in three leading countries, but in most cases one must use a grain price as if it were a food price.Table 6.3 The product pattern of price movements relative to the prices of bread or grains, European cities and regions, 1500-1790
| Product | Cities or regions | Median real-price change relative to bread or grains, c. 1500-c. 1790 | |
| The greatest real-price rises | Cinnamon | S. England, Holland, New Castle | +70% (1600-1790) |
| Housing rents | England, Paris, Holland | +40% | |
| Possibly rising slightly relative to breads and grains | Fuels | 16 Cities or regions | +14% |
| About the same trend as bread and grains | Soap | 5 Cities or regions | -1% |
| Wines | 7 Cities or regions | -3% | |
| Candles | W. Brabant, Edinburgh | -6% | |
| Meats | 7 Cities or regions | -11% | |
| Definite real-price drops relative to bread and grains | Unskilled labor | 13 Cities or regions | -37% |
| Paper | 8 Cities or regions | -53% | |
| Textiles | 9 Cities or regions | -56% | |
| Beer | 4 Cities or regions | -61% | |
| Sealing wax | S. England (1500-1700) | -65% | |
| Silver | 13 Cities or regions | -69% | |
| Sugar | Barcelona, Gdansk, New Castle | -85% |
Notes and sources-. The cities or regions involved are: Southern England, London, Edinburgh, West Brabant, Holland, The Netherlands, Paris, Barcelona, New Castle, Valencia, Andalucia, Naples, Milan, Modena, Florence, Vienna, Augsburg, Frankfurt, Krakow, Lviv, Warsaw, Gdansk, and Copenhagen.
For the numerous sources, some dating back to the International Price History Commission publications, see Hoffman et al. 2000. The Hoffman real-price series for Paris are summarized in Table 6.3.
For textiles, the 9 cities or regions exclude Italian cities for which the real price rose slightly.
Figure 6.2 Selected prices relative to the, price of bread or grain, 1500—1900: (a) Panel A., England, (b). Panel B. Paris, (c) Panel C. Holland
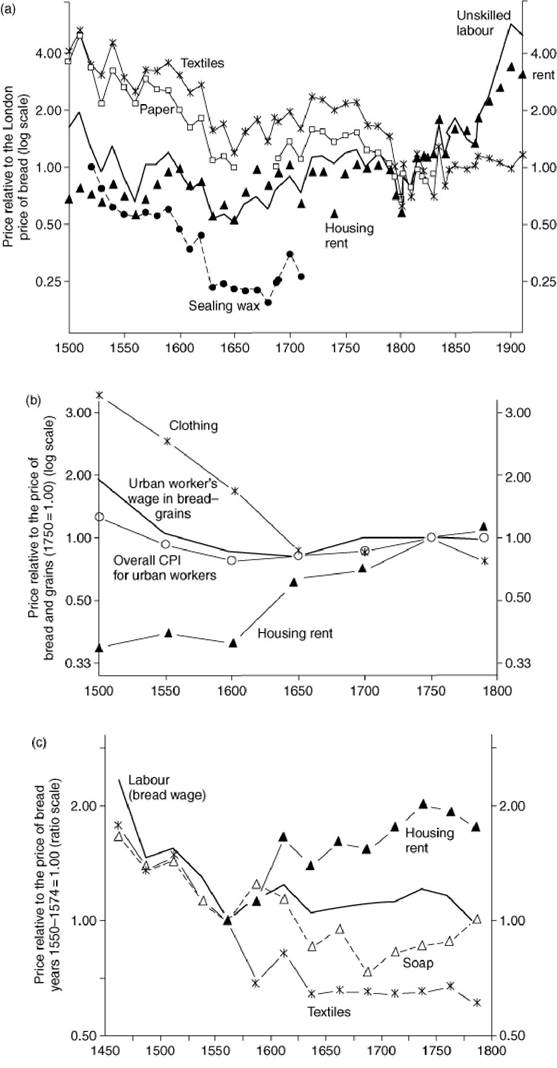
The general pattern in relative-price trends over the whole 1500—1790 period is fairly clear, despite the variations by place and by era. As sketched in Table 6.3, unskilled labour definitely fell in price (wage) relative to the cost of grains and bread. The overall three-century drop in this food wage varied between a modest 9% (Krakow) and drastic drops of more than 60% (Gdansk, Warsaw, and Spain).
The declines were concentrated in the inflationary sixteenth and the late eighteenth centuries.
So great was the rise in food scarcity that few items rose in price faster than basic food grains. The prices of meats, wine, soap, and candles moved in proportion to food-grain prices, neither faster nor slower. One category that clearly rose in price faster than food was rent, either on housing or on the land that produced that food.
Another might be the set of luxury spices from the distant tropics. Like the cinnamon price featured here, the prices of pepper, nutmeg, and cloves also rose faster than grain prices in many settings, two exceptions being pepper in sixteenth-century Augsburg and ginger and saffron in eighteenth-century Warsaw. Yet spices made up only a tiny share of household expenditures, even for the rich.11 More relevant, the cost of such fuels as firewood, charcoal, coal, and peat rose at least as fast as the food price. While the food crisis may have been greater than the fuel crisis in the sixteenth and the late eighteenth centuries, fuel scarcity was more evident than food scarcity in the trends between 1600 and 1750.While succeeding generations of unskilled workers found it increasingly hard to afford rent, food, and fuel, other product prices rose more slowly than their wage rates. That was generally true of beer, textiles and clothing, writing paper, some miscellaneous luxuries, and sugar, as sketched towards the bottom of Table 6.3. At the very bottom of the price-trend ranks were silver and national moneys of account, since these centuries brought considerable price inflation. Setting aside the two forms of money, the products falling in price relative to food had two salient features: (1) their production made intensive use of factors that were getting cheaper across these centuries and (2) they tended to be luxuries.
Table 6.4 Movements in non-staple prices relative to staple food-grain prices, selected places and periods, 1500—1790
| Place | Non-sta- ple price numerator | Food-grain price denominator | Rate of relative-price movement, % per decade | Total net % change in periods covered here | Notes | ||||
| £1500-1 600 | r.1600-1- 650 | r.1650-1- 700 | r.1700-1- 750 | r.1750-1- 790 | |||||
| Unskilled labour | |||||||||
| S. England | Labour | /Bread, London | -5.04 | -11.69 | 11.90 | 5.89 | -4.52 | -37.86 | (a) |
| Paris | Labour | /Bread | -7.67 | -2.71 | 5.93 | 1.43 | 0.47 | -42.75 | (b) |
| Holland | Labour | /Bread | -2.38 | -1.65 | 1.08 | 1.70 | -4.20 | -33.00 | (c) |
| Barcelo na | Labour | /Wheat | -9.09 | 10.31 | -5.37 | -3.17 | -15.34 | -64.11 | (e) |
| New Castile | Labour | /Wheat | — | — | — | — | -16.17 | — | (e) |
| Valencia | Labour | /Wheat | -4.88 | — | — | 3.25 | -18.11 | -68.02 | (e) |
| Andalu cia | Labour | /Wheat | — | -8.32 | 1.98 | -10.37 | 3.35 | -52.86 | (e) |
| Vienna | Labour | /Wheat | — | 7.17 | -9.18 | -0.43 | -7.19 | -24.34 | (f) |
| West Brabant | Labour | /Rye | -4.84 | -4.65 | 5.45 | 4.08 | -4.32 | -35.32 | (g) |
| Frankfur | t Labour | /Rye | -8.65 | 9.99 | — | — | — | — | (!) |
| Naples | Labour | /Barley | — | — | — | — | -3.87 | — | (j) |
| Milan | Labour | /Bread | — | -10.79 | 11.51 | -3.74 | -3.80 | -21.94 | (k) |
| Florence | Labour | /Food grain | -1.90 | — | — | — | — | — | (l) |
| Modena | Labour | /Wheat | -7.44 | -0.80 | 6.70 | — | — | — | 1552-17 00, (m) |
| Edinburgh | Labour | /Bread | -8.32 | 3.58 | 6.89 | -5.28 | 10.13 | -7.71 | 1530-17 80, (n) |
| Gdansk (Danzig) | Labour | /Rye | -11.09 | 10.27 | -4.04 | -5.13 | -11.60 | -67.39 | (p) |
| Warsaw | Labour | /Rye | — | 1.19 | -22.79 | -9.69 | 6.12 | -61.49 | (q) |
| Krakow | Labour | /Rye | — | 1.38 | 3.38 | 4.81 | -13.21 | -9.30 | (r) |
| Labour | Me- dians= | -7.44 | 0.20 | 3.38 | -0.43 | -4.32 | -37.86 | ||
| Housing rent | |||||||||
| S. England | Housing rent | /Bread, London | 3.78 | -11.68 | 14.31 | -2.14 | 1.01 | 42.06 | (a) |
| Paris | Housing rent | /Bread | 0.43 | 13.24 | 3.55 | 8.70 | 2.99 | 295.24 | (b) |
| Holland | Housing rent | /Bread | — | 4.53 | 1.94 | 5.51 | -2.69 | 56.73 | (c) |
| Fuel | |||||||||
| S. England | Coal | /Bread, London | -2.17 | 16.19 | 3.55 | -2.63 | 103.06 | — | (a) |
| Paris | Firewood | /Bread | -6.90 | 15.56 | 0.74 | 5.32 | 2.48 | 49.48 | (b) |
| Holland | Peat | /Bread | -1.33 | -2.77 | -4.19 | 7.53 | -0.35 | -13.35 | (c) |
| Barcelo na | Firewood | /Wheat | — | 2.37 | 5.05 | -4.50 | — | 14.25 | (e) |
| Barcelo na | Charcoal | /Wheat | -6.27 | 1.94 | 6.57 | -3.18 | 6.19 | -14.24 | (e) |
| New Castile | Firewood | /Wheat | — | -14.77 | 0.42 | -1.47 | -3.43 | -62.91 | (e) |
| New Castile | Charcoal | /Wheat | — | 0.82 | 7.03 | -8.66 | 0.05 | 6.76 | (e) |
| Valencia | Firewood | /Wheat | -3.43 | 2.95 | — | — | — | — | (e) |
| Valencia | Charcoal | /Wheat | -10.65 | 1.66 | — | — | — | — | (e) |
| Andalucia | Firewood | /Wheat | -18.54 | -5.51 | — | — | — | — | 1553-16 48, (e) |
| Andalu cia | Charcoal | /Wheat | -2.16 | -0.89 | — | — | — | — | 1553-16 48, (e) |
| Vienna | Firewood | /Wheat | — | -0.73 | 2.08 | 2.16 | -3.62 | 1.99 | (f) |
| West Brabant | Charcoal | /Rye | -8.46 | 9.10 | 1.39 | 15.24 | -2.21 | 29.48 | (g) |
| Augsbur | gBeef | /Rye | 2.75 | 0.34 | 0.73 | 9.38 | -5.86 | 69.19 | (h) |
| Frankfur | t Charcoal | /Rye | 3.34 | -3.35 | -0.58 | 14.64 | 4.32 | 162.41 | (i) |
| Naples | Firewood | /Barley | — | — | — | — | -1.89 | — | (j) |
| Milan | Charcoal | /Bread | — | -0.59 | 1.20 | 1.15 | 3.41 | 25.31 | (k) |
| Florence | Firewood | /Food grain | -2.77 | — | — | — | — | — | (l) |
| Copenha gen | Firewood | /Wheat | — | — | — | -11.93 | -7.35 | — | (o) |
| Gdansk (Danzig) | Firewood | /Rye | — | — | — | 2.13 | -3.26 | — | (P) |
| Krakow | Firewood | /Rye | -5.30 | 0.15 | 0.90 | -17.26 | — | -72.50 | (r) |
| Fuels | Me- dians= | -4.37 | 0.15 | 1.20 | 2.13 | -2.05 | 14.25 | ||
| Meats | |||||||||
| S. England | Meat | /Bread, London | 4.93 | -11.58 | 8.88 | -1.43 | 4.77 | 49.96 | (a) |
| Paris | Beef | /Bread | -13.96 | -7.11 | 0.77 | -1.31 | 3.97 | -82.53 | (b) |
| Holland | Meat | /Bread | -1.72 | 1.09 | -0.32 | 2.44 | -2.04 | -11.15 | (c) |
| Barcelo na | Meat | /Wheat | -0.13 | 1.88 | 1.72 | -2.90 | -6.27 | -21.40 | (e) |
| New Castile | Meat | /Wheat | -1.78 | -3.33 | 15.58 | -10.55 | -2.40 | -24.38 | (e) |
| Valencia | bgcolor=white>Meat/Wheat | -1.01 | 2.05 | — | — | — | — | (e) | |
| Andalu cia | Meat | /Wheat | -3.53 | 4.34 | — | — | — | — | 1553-16 48, (e) |
| West Brabant | Beef | /Rye | -2.20 | 0.78 | 6.21 | 4.08 | 1.54 | 46.62 | (g) |
| Frankfui | tBeef | /Rye | — | 7.64 | -4.12 | 0.58 | 0.46 | 22.70 | (!) |
| Naples | Veal | /Barley | — | — | — | — | 5.18 | — | (j) |
| Milan | Veal | /Bread | — | — | — | -3.30 | 6.01 | — | (k) |
| Florence | Meat | /Food grain | -2.51 | — | — | — | — | — | (l) |
| Modena | Veal | /Wheat | -7.29 | — | — | — | — | — | 1510-16 00, (m) |
| Gdansk (Danzig) | Beef | /Rye | — | — | — | -0.46 | -9.37 | — | (p) |
| Meats | Me- dians= | -1.99 | 1.09 | 1.72 | -1.31 | 1.00 | -11.15 | ||
| Beer | |||||||||
| Augs burg | Beer | /Rye | — | — | -2.11 | 3.80 | -5.09 | -12.12 | (h) |
| Gdansk (Danzig) | Beer | /Rye | 0.10 | -1.08 | -2.69 | -7.14 | -6.38 | -55.91 | (P) |
| Warsaw | Beer | /Rye | — | 2.34 | -26.23 | -17.56 | -5.11 | -85.24 | (q) |
| Krakow | Beer | /Rye | -6.47 | -3.03 | -3.80 | 17.58 | -19.53 | -65.86 | (r) |
| Wine | |||||||||
| Barcelo na | Wine | /Wheat | 6.56 | 5.66 | -7.08 | -6.88 | -2.56 | 8.61 | (e) |
| New Castile | Wine | /Wheat | 2.11 | -5.06 | 13.02 | -2.65 | -11.55 | -6.27 | (e) |
| Valencia | Wine | /Wheat | -0.09 | -4.82 | — | — | — | — | (e) |
| Andalu cia | Wine | /Wheat | -15.15 | 9.00 | 5.42 | 10.24 | -8.73 | -0.47 | 1553-17 98, (e) |
| Frankfur | tWine | /Rye | 3.38 | 4.76 | — | — | — | — | (i) |
| Milan | Wine | /Bread | — | -1.61 | 7.80 | 2.39 | -11.10 | -3.09 | (k) |
| Modena | Wine, red | /Wheat | -10.37 | 2.88 | 12.18 | — | — | -31.49 | 1552-17 00, (m) |
| Copenhagen | Wine | /Wheat | — | — | — | — | -6.40 | — | (o) |
| Gdansk (Danzig) | Wine (Rhine) | /Rye | — | — | — | -0.24 | -13.19 | — | (P) |
| Warsaw | Wine | /Rye | -16.05 | -12.26 | -0.47 | -12.15 | -5.10 | -94.01 | (q) |
| Krakow | Wine | /Rye | -3.01 | -6.47 | 19.49 | 14.38 | -16.12 | 24.54 | (r) |
| Wine | Medians= | -1.55 | -1.61 | 7.80 | -0.24 | -9.92 | -3.09 | ||
| Sugar | |||||||||
| S. England | Sugar | /Bread, London | — | — | 5.68 | 0.17 | -4.13 | 6.25 | 1660-17 90, (a) |
| Barcelo na | bgcolor=white>Sugar /Wheat | 5.24 | -3.34 | -20.81 | -11.67 | -4.42 | -82.85 | 1558-17 98, (e) | |
| New Castile | Sugar | /Wheat | -3.30 | -2.95 | -13.73 | -8.11 | -7.75 | -84.53 | 1553-17 98, (e) |
| Valencia | Sugar | /Wheat | 3.23 | -0.89 | — | — | — | — | (e) |
| Andalu cia | Sugar | /Wheat | 4.18 | -3.04 | — | — | — | — | 1553-16 48, (e) |
| Augsbur | g Sugar | /Rye | — | -3.64 | -14.62 | — | — | — | (h) |
| Naples | Sugar | /Barley | — | — | — | — | 1.80 | — | (j) |
| Milan | Sugar | /Bread | — | — | — | -9.10 | 2.79 | — | (k) |
| Florence | Sugar | /Food grain | -6.45 | — | — | — | — | — | (l) |
| Florence | Wine | /Food grain | 1.36 | — | — | — | — | — | (l) |
| Modena | Sugar | /Wheat | -4.32 | 7.29 | — | — | — | — | 1552-16 50, (m) |
| Gdansk (Danzig) | Sugar | /Rye | — | — | — | -7.91 | -24.12 | — | (p) |
| Warsaw | Sugar | /Rye | — | — | -26.58 | -10.56 | -15.04 | -88.11 | (q) |
| Sugar | Me- dians= | 1.36 | -3.00 | -14.62 | -8.61 | -4.42 | -83.69 | ||
| Cinnamon | |||||||||
| S. England | Cinna mon | /Bread, London | — | — | 2.64 | 0.10 | 12.47 | 78.48 | 1660-17 90, (a) |
| Holland | Cinna mon | /Bread | — | 14.65 | 5.78 | -1.68 | 17.01 | 275.50 | (d) |
| New Castile | Cinna mon | /Wheat | — | 12.50 | 11.17 | -8.95 | 3.60 | 120.59 | (e) |
| Krakow | Cinna mon | /Rye | -6.65 | — | — | — | — | — | (r) |
| Soap | |||||||||
| S. England | Soap | /Bread, London | — | -16.63 | 16.65 | -0.07 | 7.06 | -0.65 | 1600-17 70, (a) |
| Holland | Soap | /Bread | -1.28 | -7.27 | -3.05 | 3.26 | 3.35 | -28.52 | (c) |
| Barcelo na | Soap | /Wheat | — | 5.05 | 2.33 | -6.75 | 0.52 | 3.31 | (e) |
| New Castile | Soap | /Wheat | — | — | -10.44 | -4.82 | 2.71 | -49.89 | (e) |
| Valencia | Soap | /Wheat | -3.07 | -5.34 | — | — | — | — | (e) |
| Andalu cia | Soap | /Wheat | 1.89 | -1.85 | — | — | — | — | 1553-16 48, (e) |
| Vienna | Soap | /Wheat | — | -0.12 | -3.17 | 6.51 | -3.72 | -0.74 | (f) |
| Copenha gen | Soap | /Wheat | — | — | — | — | -12.85 | — | (o) |
| Soap | Me- dians= | -1.28 | -3.59 | -3.05 | -0.07 | 1.62 | -0.74 | ||
| Candles | |||||||||
| West Brabant | Candles | /Rye | -3.19 | -7.56 | 2.65 | bgcolor=white>5.6710.18 | 8.74 | (g) | |
| Frankfur | t Candle wax | /Rye | -3.71 | -5.02 | — | — | — | — | (i) |
| Naples | Candles | /Barley | — | — | — | — | -3.21 | — | (j) |
| Milan | Candles | /Bread | — | — | — | -5.05 | -1.62 | — | (k) |
| Florence | Tallow candles | /Food grain | -0.62 | — | — | — | — | — | (l) |
| Modena | Candle (sego) | /Wheat | 1.07 | -4.54 | — | — | — | — | 1552-17 00, (m) |
| Edinburgh | Candles | /Bread | -6.22 | 0.17 | 6.84 | -2.45 | — | -20.88 | 1530-17 50, (n) |
| Gdansk (Danzig) | Candles | /Rye | — | — | — | -0.06 | -8.53 | — | (p) |
| Candles | Me- dians= | -3.19 | -4.78 | 4.75 | -1.26 | -2.41 | -6.07 | ||
| Textiles | |||||||||
| S. England | Textiles | /Bread, London | -2.91 | -17.02 | 10.51 | 2.02 | -9.65 | -56.47 | (a) |
| S. England | Velvet | /Bread, London | — | — | — | -3.85 | -13.36 | -53.70 | (a) |
| Paris | Wool socks | /Bread | -9.75 | -13.64 | 1.01 | 4.84 | -5.15 | -81.43 | (b) |
| Holland | Textiles | /Bread | -6.63 | -1.30 | 0.07 | 0.21 | -1.53 | -55.75 | (c) |
| New Castile | Linen | /Wheat | — | 1.50 | -3.18 | -4.91 | -1.13 | -21.26 | (e) |
| West Brabant | Linen | /Rye | -14.19 | -7.69 | 4.12 | 10.71 | -11.04 | -80.94 | (g) |
| Augsbur | g Canvas | /Rye | -5.40 | 0.50 | -8.88 | 8.63 | -5.61 | -55.12 | (h) |
| Frankfur | t Linen | /Rye | -6.27 | 0.06 | -13.92 | — | — | — | (i) |
| Naples | Cotton cloth | /Barley | — | — | — | — | 7.22 | — | (j) |
| Milan | Cloth/li- nen | /Bread | — | -6.78 | 8.59 | -3.33 | 4.00 | 14.18 | (k) |
| Florence | Cloth | /Food grain | -8.55 | — | — | — | — | — | (l) |
| Modena | Cloth (alto) | /Wheat | — | 0.99 | 9.33 | — | — | — | 1552-17 00, (m) |
| Gdansk (Danzig) | Woollen (gray) | /Rye | — | — | — | -0.55 | -0.38 | — | (p) |
| Warsaw | Linen | /Rye | — | — | — | -29.45 | 16.85 | — | (q) |
| Krakow | Linen | /Rye | -15.74 | -15.75 | 10.56 | 8.67 | -7.50 | -85.97 | (r) |
| Textiles | Me- dians= | -7.59 | -4.04 | 2.56 | 0.21 | -3.34 | -55.75 | ||
| Paper | |||||||||
| S. England | Paper | /Bread, London | -5.46 | -12.90 | — | 1.58 | -8.89 | -76.39 | ends in 1777/81, (a) |
| Paris | Paper | /Bread | -6.80 | -21.52 | — | — | — | -85.27 | 1500-16 50 (b) |
| Barcelo na | bgcolor=white>Paper /Wheat | -3.75 | 8.88 | -12.29 | 3.12 | -7.34 | -53.42 | (e) | |
| New Castile | Paper | /Wheat | — | — | -6.46 | 0.05 | -6.04 | -44.04 | (e) |
| Vienna | Paper | /Wheat | — | -1.98 | -0.21 | -10.01 | -7.19 | -55.97 | (f) |
| Augsbur | g Paper | /Rye | -6.84 | -4.35 | -7.20 | 10.64 | 2.74 | -49.14 | (h) |
| Frankfur | t Paper | /Rye | 0.82 | 1.47 | -6.20 | 1.57 | — | -16.06 | (i) |
| Gdansk (Danzig) | Paper | /Rye | — | — | — | 14.12 | -11.78 | — | (p) |
| Warsaw | Paper | /Rye | — | — | — | -16.96 | 2.40 | — | (q) |
| Krakow | Paper | /Rye | -12.53 | 0.12 | 3.65 | 7.11 | — | -52.56 | (r) |
| Paper | Me- dians= | -6.13 | -1.98 | -6.33 | 1.58 | -7.19 | -52.99 | ||
| Silver | |||||||||
| England | Silver | /Bread, London | -10.28 | -11.80 | 6.44 | 1.58 | -6.89 | -79.97 | (a) |
| Paris | Silver | /Bread | -13.89 | -3.97 | 7.06 | 6.85 | -5.34 | -71.22 | (b) |
| The Netherlands | Silver | /Rye | -10.56 | -0.66 | -2.05 | 8.25 | -7.66 | -69.11 | (s) |
| Barcelo na | Silver | /Wheat | -8.94 | -4.48 | 8.75 | 6.83 | -13.61 | -63.27 | (e) |
| Andalu cia | Silver | /Wheat | — | -2.08 | 12.45 | 8.92 | -15.16 | 28.61 | (e) |
| New Castile | Silver | /Wheat | -14.70 | -3.02 | 14.42 | 1.93 | -16.74 | -81.87 | (e) |
| Valencia | Silver | /Wheat | -9.67 | -4.30 | 7.05 | 3.46 | -11.46 | -70.28 | (e) |
| Belgium | Silver | /Wheat | -11.79 | -5.12 | 0.89 | 11.65 | -5.34 | -68.08 | (s) |
| Northern Italy | Silver | /Wheat | -11.72 | 8.30 | 10.66 | -1.61 | -7.33 | -45.25 | (s) |
| Frankfur | t Silver | /Rye | -11.54 | -3.19 | -8.13 | 5.23 | -2.98 | -81.34 | (s) |
| Augsbur | g Silver | /Rye | -8.60 | -1.85 | 0.21 | -6.34 | 6.97 | -64.62 | (s) |
| Austria | Silver | /Rye | -7.69 | -4.28 | -1.26 | 2.99 | 0.17 | -60.47 | (s) |
| Poland | Silver | /Rye | -20.70 | -6.24 | 3.90 | 4.49 | -3.84 | -90.81 | (s) |
| Silver | Medians= | -11.05 | -3.97 | 6.44 | 4.49 | -6.89 | -69.11 | ||
| Miscellaneous products | |||||||||
| S. England | Chocolate | /Bread, London | — | — | — | 5.34 | -17.35 | -39.46 | (a) |
| S. England | Pewter | /Bread, London | -3.92 | -11.97 | — | — | — | — | (a) |
| S. England | Sealing wax | /Bread, London | -7.96 | -13.47 | 8.86 | — | — | -64.84 | 1510-17 00, (a) |
Notes and sources-. ‘Labour’ here means unskilled non-agricultural labour hired by institutions, usually for building, but also for menial tasks.
(a) England. Centred five-year averages through 1700, then annual figures. Prices for London bread are from Mitchell (1988) spliced to Boulton's (2000) flour series for 1580—1700, and to the Phelps Brown and Hopkins (1957, 1981) farinaceous series for 1500-40. Housing rents are from Clark (2002). The series for soap, velvet, chocolate, cinnamon, pewter, and sealing wax are from Beveridge (1939). The prices of silver are taken from Feavearyear (1963).
' Paris. Centred nine-year averages. The figures for wool socks include quotes from Orleans as well as from Paris. The bread series is extended back before 1750 using a wheat series. The sources are Baulant (1968, 1971, 1976), d'Avenel (1894-1926), and Hauser (1936).
(c) Holland. The source is van Zanden (2000). The actual time periods are the quarter centuries just prior to the years shown. Thus, c.1500 is really 1475-99; c.1600 is 1575-99, and so on, except that 1790 is really 1775-99. The overall-period change for house rents covers only the period since 1575-99.
(d) Posthumus, cinnamon. The source is Posthumus (1946. Table 66).
(e) Spain. The sources are Feliu i Montfort (1991) for most series, and Hamilton (1934, 1947) for linen and cinnamon. Most of the five-year averages are centred on 1503, 1550, 1600 (nine-year averages), 1648, 1700, 1750, and 1798.
(f) Vienna. The source is Pribram et al. (1938). The time periods are bounded by the averages for 1593-7, 1653-7, 1698-1702, 1738-47, and 1773-7.
g West Brabant. The main source is Verlinden et al. (1959-65) with some pre-1600 data from van der Wee (1963). The rates are based on five-year averages, except that ‘1500’ is centred on 1502.
w Augsburg. The source is Elsas (1936-49). The estimates are rates of change between five-year averages.
(i) Frankfurt. The source is Elsas (1936-49). The estimates are rates of change between five-year averages, with some use of nearby dates necessary.
® Naples. The source is Romano (1965).
(k) Milan. The sources are De Maddalena (1950) and Sella (1968) for 1605/09-1648/52 and 1648/52-1701/05, and De Maddalena (1974) for 1701/05-1748/52 and 1748/52-1788/92. Wheat bread (pano) is the deflator to the c.1700 dates, then wheat. Each commodity changes definition slightly between the seventeenth-century periods and the eighteenth-century periods. Labour changes from ‘lavorante o garzone’ to a mason's assistant or boy. The fuel item changes from charcoal (carbone de legno) to firewood (legna). Wine becomes specifically white wine in the eighteenth-century series. The cloth item changes from woollen cloth ‘alto’ to linen cloth.
® Florence. The source is Parenti (1942, 1967). The changes are from 1520/22 to 1608/12. The rate of price change for meat is a simple average of the rates of change in the grain prices of veal, beef, and mutton.
(m) Modena. The source is Basini (1974). The initial and final quinquennia are 1550-4 and 1696-1700.
(n) Edinburgh. The source is Gibson and Smout (1995).
(o) Copenhagen. The source is Friis and Glamann (1958). The initial date is 1712, and the interim benchmark for firewood is 1739-42.
w Gdansk (Danzig). The sources are Pelc (1937) and Furtak (1935). The benchmark dates are 1543-7, 1598-1602, 1648-52, and 1696-1700 for the first three columns, and 1701-5, 1748-52, 1788-92 for the next two columns. Caution-. The period 164753 was one of extraordinarily high grain prices, lowering all the real prices deflated by the 1648-52 rye price here.
(q)
(r)
(s)
Warsaw: The sources are Adamcyk (1938) for prices and unskilled wages 1558—1700, and Siegel (1936,1949) for prices and unskilled wages 1701-1815.
Krakow: The sources are Pelc (1935) for prices through 1600, and Tomaszewski (1934) for prices and wages from 1601 on.
Silver prices, in terms of food grains: Abel (1973: Tables I, II). The averages refer to the decades ending in the rounded year: 1491-1500 for 1500, etc. up to 1781-90 for 1790. The only exception is that the 1500 benchmark for Northern Italyis represented by 1501-10.
The falling-real-price products in the lower half of Table 6.3 tended to make relatively more use of labour and capital, which were falling in relative price.12 By contrast, the main rising-real-price products—housing, fuel, and food—called for more intensive use of land (farmland, forests, and mineral reserves); the factor that was rising in price. The pattern does not fit perfectly, of course. Spices were not land intensive in a sense that is meaningful for western Europe, and increasingly cheap sugar did use land. Yet as a general rule, land intensity is lower in the lower half of Table 6.3's list of products. This factor—price pattern suggests a cost-side explanation for some of the price trends.
The other salient feature of the falling-real-price products in the lower half of Table 6.3 is that they tended to be luxuries, or at least not staples. The tendency was rough, and had its exceptions. Beer was a luxury in the working-class end of the spectrum, though sugar was not (Clark et al. 1995: 224) and luxury wines did not fall in price relative to food grains. Most studies find that clothing was slightly a luxury good, which should imply the same for the textiles that were fashioned into clothing. Writing paper, chocolate, pewter, and sealing wax were surely luxury goods, and they fell considerably in price relative to food grains.13 And as we shall note in Section 6, labour itself was a luxury, in the sense that the rich spent a greater share of their income buying labour.
This inter-product pattern in real prices before 1820 brought greater real-income gains for richer regions, just as it did for richer classes within each region. Developing truly national cost-of-living indices, with luxuries taking a greater share of expenditure in the richer regions, would probably show that the global inequality of real purchasing power rose faster than the global inequality of income measured in units of any one good such as silver or wheat.
6.
More on the topic Cheaper luxuries, greater divergence between nations:
- Allen R.C., Bengtsson T., Dribe M.. Living Standards in the Past: New Perspectives on Well-Being in Asia and Europe. Oxford University Press,2005. - 495 p., 2005
- Chapters on Practical Political Economy (1878)
- Value and distribution